Fig. 10.

Download original image
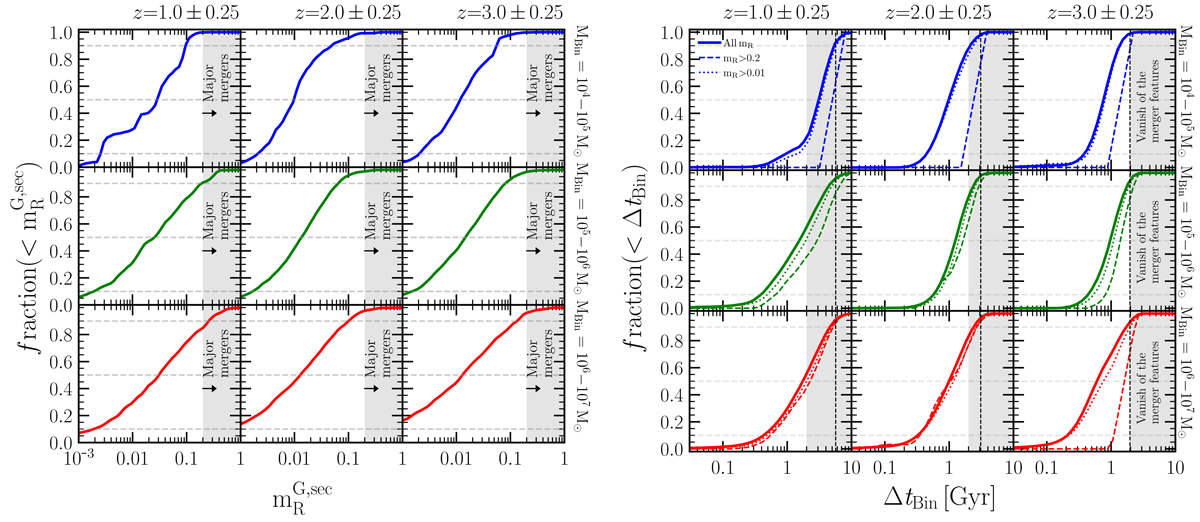
Merger history of the hosts of LISA MBHBs. Left panel: cumulative distribution of the baryonic mass ratio (![]() ) of the two galaxies involved in the interaction that brought the secondary MBH to the primary galaxy. Different columns correspond to different redshift bins: z = 1 ± 0.25 (left), z = 2 ± 0.25 (middle), and z = 3 ± 0.25 (right). The horizontal dashed grey lines highlight the values 0.1, 0.5, and 0.9. The shaded region corresponds to the merger ratios associated with major mergers in L-Galaxies. Right panel: same as left panel but for the values of the delay time, ΔtBin, between the galaxy–galaxy merger and that of the binary. In this case, the shaded area represents the region where the merger signatures have vanished at the time of LISA detection. Dashed and dotted lines represent the same but for galaxy interactions with mR > 0.2 and 0.01, respectively. In all panels, vertical dashed lines correspond to the Hubble time at z = 1 (left panel), z = 2 (middle panel), and z = 3 (right panel). In general, the distributions shown in these figures show that more than 50% of the LISA MBHBs result from galaxy mergers with a baryonic mass ratio of greater than 0.01, with a minor contribution to major mergers. We stress that these baryonic ratios do not imply that the binaries display the same mass ratios at inspiral and coalescence. This is due to the gas accretion of MBHBs along the galaxy evolution.
) of the two galaxies involved in the interaction that brought the secondary MBH to the primary galaxy. Different columns correspond to different redshift bins: z = 1 ± 0.25 (left), z = 2 ± 0.25 (middle), and z = 3 ± 0.25 (right). The horizontal dashed grey lines highlight the values 0.1, 0.5, and 0.9. The shaded region corresponds to the merger ratios associated with major mergers in L-Galaxies. Right panel: same as left panel but for the values of the delay time, ΔtBin, between the galaxy–galaxy merger and that of the binary. In this case, the shaded area represents the region where the merger signatures have vanished at the time of LISA detection. Dashed and dotted lines represent the same but for galaxy interactions with mR > 0.2 and 0.01, respectively. In all panels, vertical dashed lines correspond to the Hubble time at z = 1 (left panel), z = 2 (middle panel), and z = 3 (right panel). In general, the distributions shown in these figures show that more than 50% of the LISA MBHBs result from galaxy mergers with a baryonic mass ratio of greater than 0.01, with a minor contribution to major mergers. We stress that these baryonic ratios do not imply that the binaries display the same mass ratios at inspiral and coalescence. This is due to the gas accretion of MBHBs along the galaxy evolution.
Current usage metrics show cumulative count of Article Views (full-text article views including HTML views, PDF and ePub downloads, according to the available data) and Abstracts Views on Vision4Press platform.
Data correspond to usage on the plateform after 2015. The current usage metrics is available 48-96 hours after online publication and is updated daily on week days.
Initial download of the metrics may take a while.


