Fig. 9
Download original image
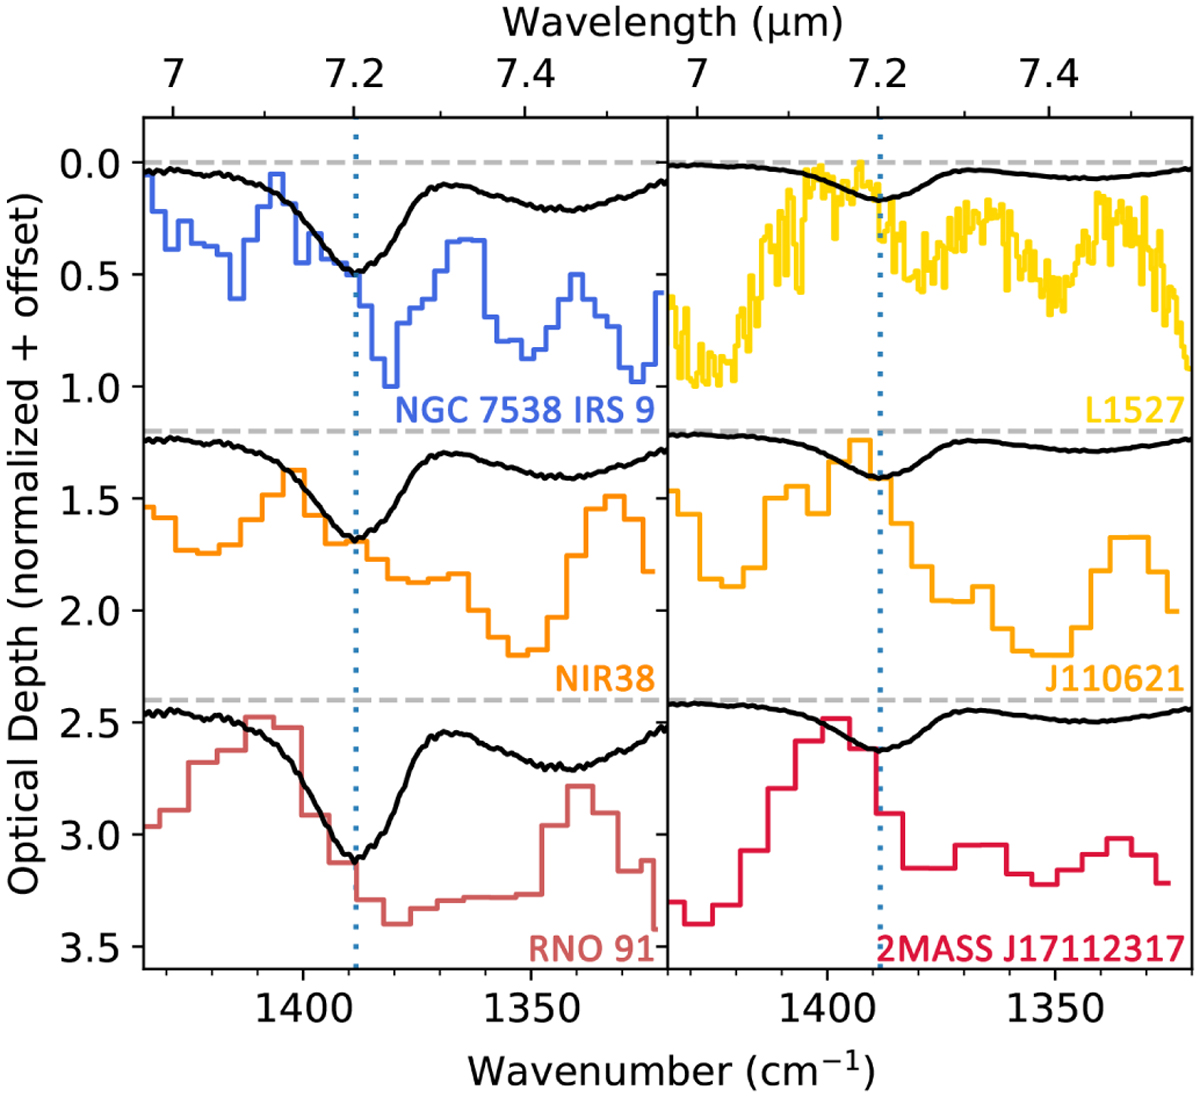
Examples of fits of the CH bending band in the formamide:H2O laboratory spectrum (in black, water contribution subtracted out) to the local-continuum subtracted observed spectra (in color) used to derive solid-state formamide upper limits. The peak position of the CH bend in the laboratory spectrum is marked with a dotted blue vertical line. These selected fits showcase the variation in the profile of the observed 7.24 μm band across the selected sources. In the observed spectra on the left, excess absorption on the blue wing of the observed 7.24 μm band allows for relatively high formamide upper limits (~≤1.5–5.1% with respect to H2O), while the observed spectra on the right lack such a wing, resulting in lower formamide upper limits (~≤0.35–0.68% with respect to H2O).
Current usage metrics show cumulative count of Article Views (full-text article views including HTML views, PDF and ePub downloads, according to the available data) and Abstracts Views on Vision4Press platform.
Data correspond to usage on the plateform after 2015. The current usage metrics is available 48-96 hours after online publication and is updated daily on week days.
Initial download of the metrics may take a while.