Fig. 8
Download original image
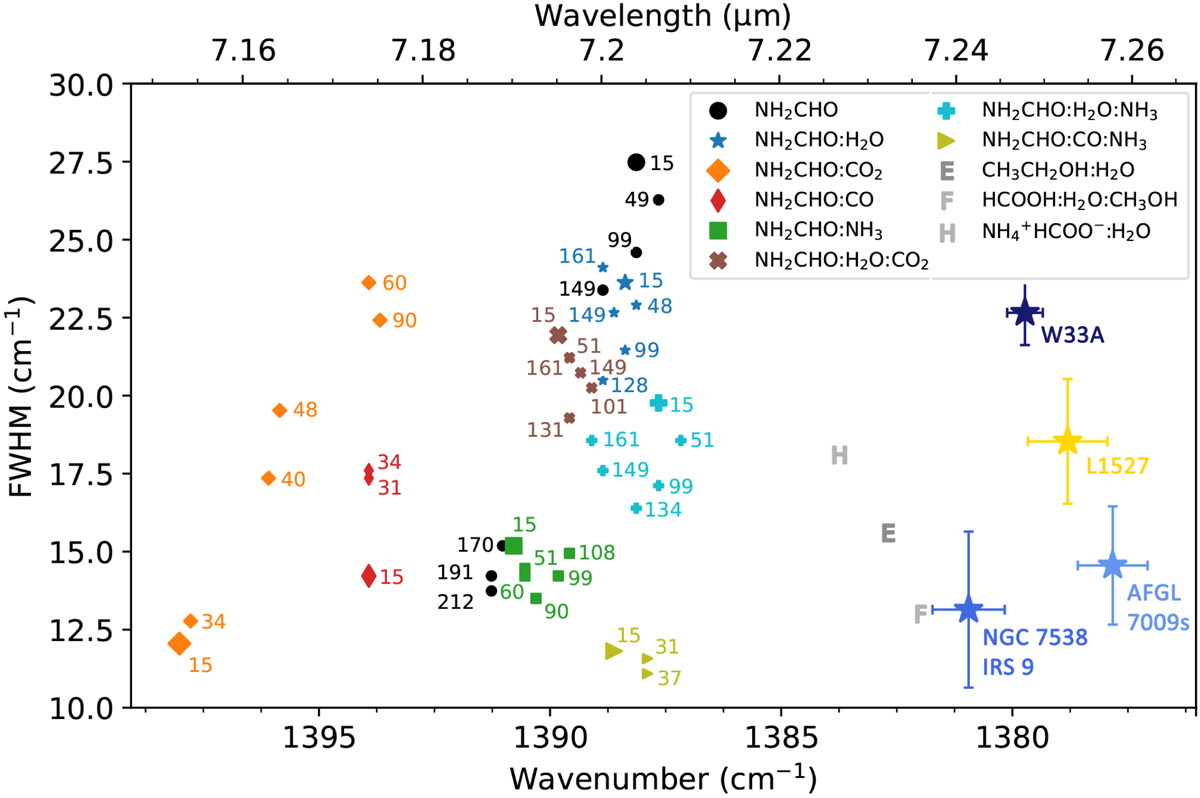
Scatter plot containing all the same peak position and FWHM values of formamide’s CH bend from Fig. 6 along with the peak positions and FWHM values of the 7.24 μm peaks in the W33A, NGC 7538 IRS 9, AFGL 7009s, and L1527 spectra shown in Fig. 7 and laboratory spectra of CH3CH2OH:H2O (van Scheltinga et al. 2018), HCOOH:H2O:CH3OH (Bisschop et al. 2007a) and NH4+HCOO−:H2O at 150 K (Galvez et al. 2010).
Current usage metrics show cumulative count of Article Views (full-text article views including HTML views, PDF and ePub downloads, according to the available data) and Abstracts Views on Vision4Press platform.
Data correspond to usage on the plateform after 2015. The current usage metrics is available 48-96 hours after online publication and is updated daily on week days.
Initial download of the metrics may take a while.