Fig. 7
Download original image
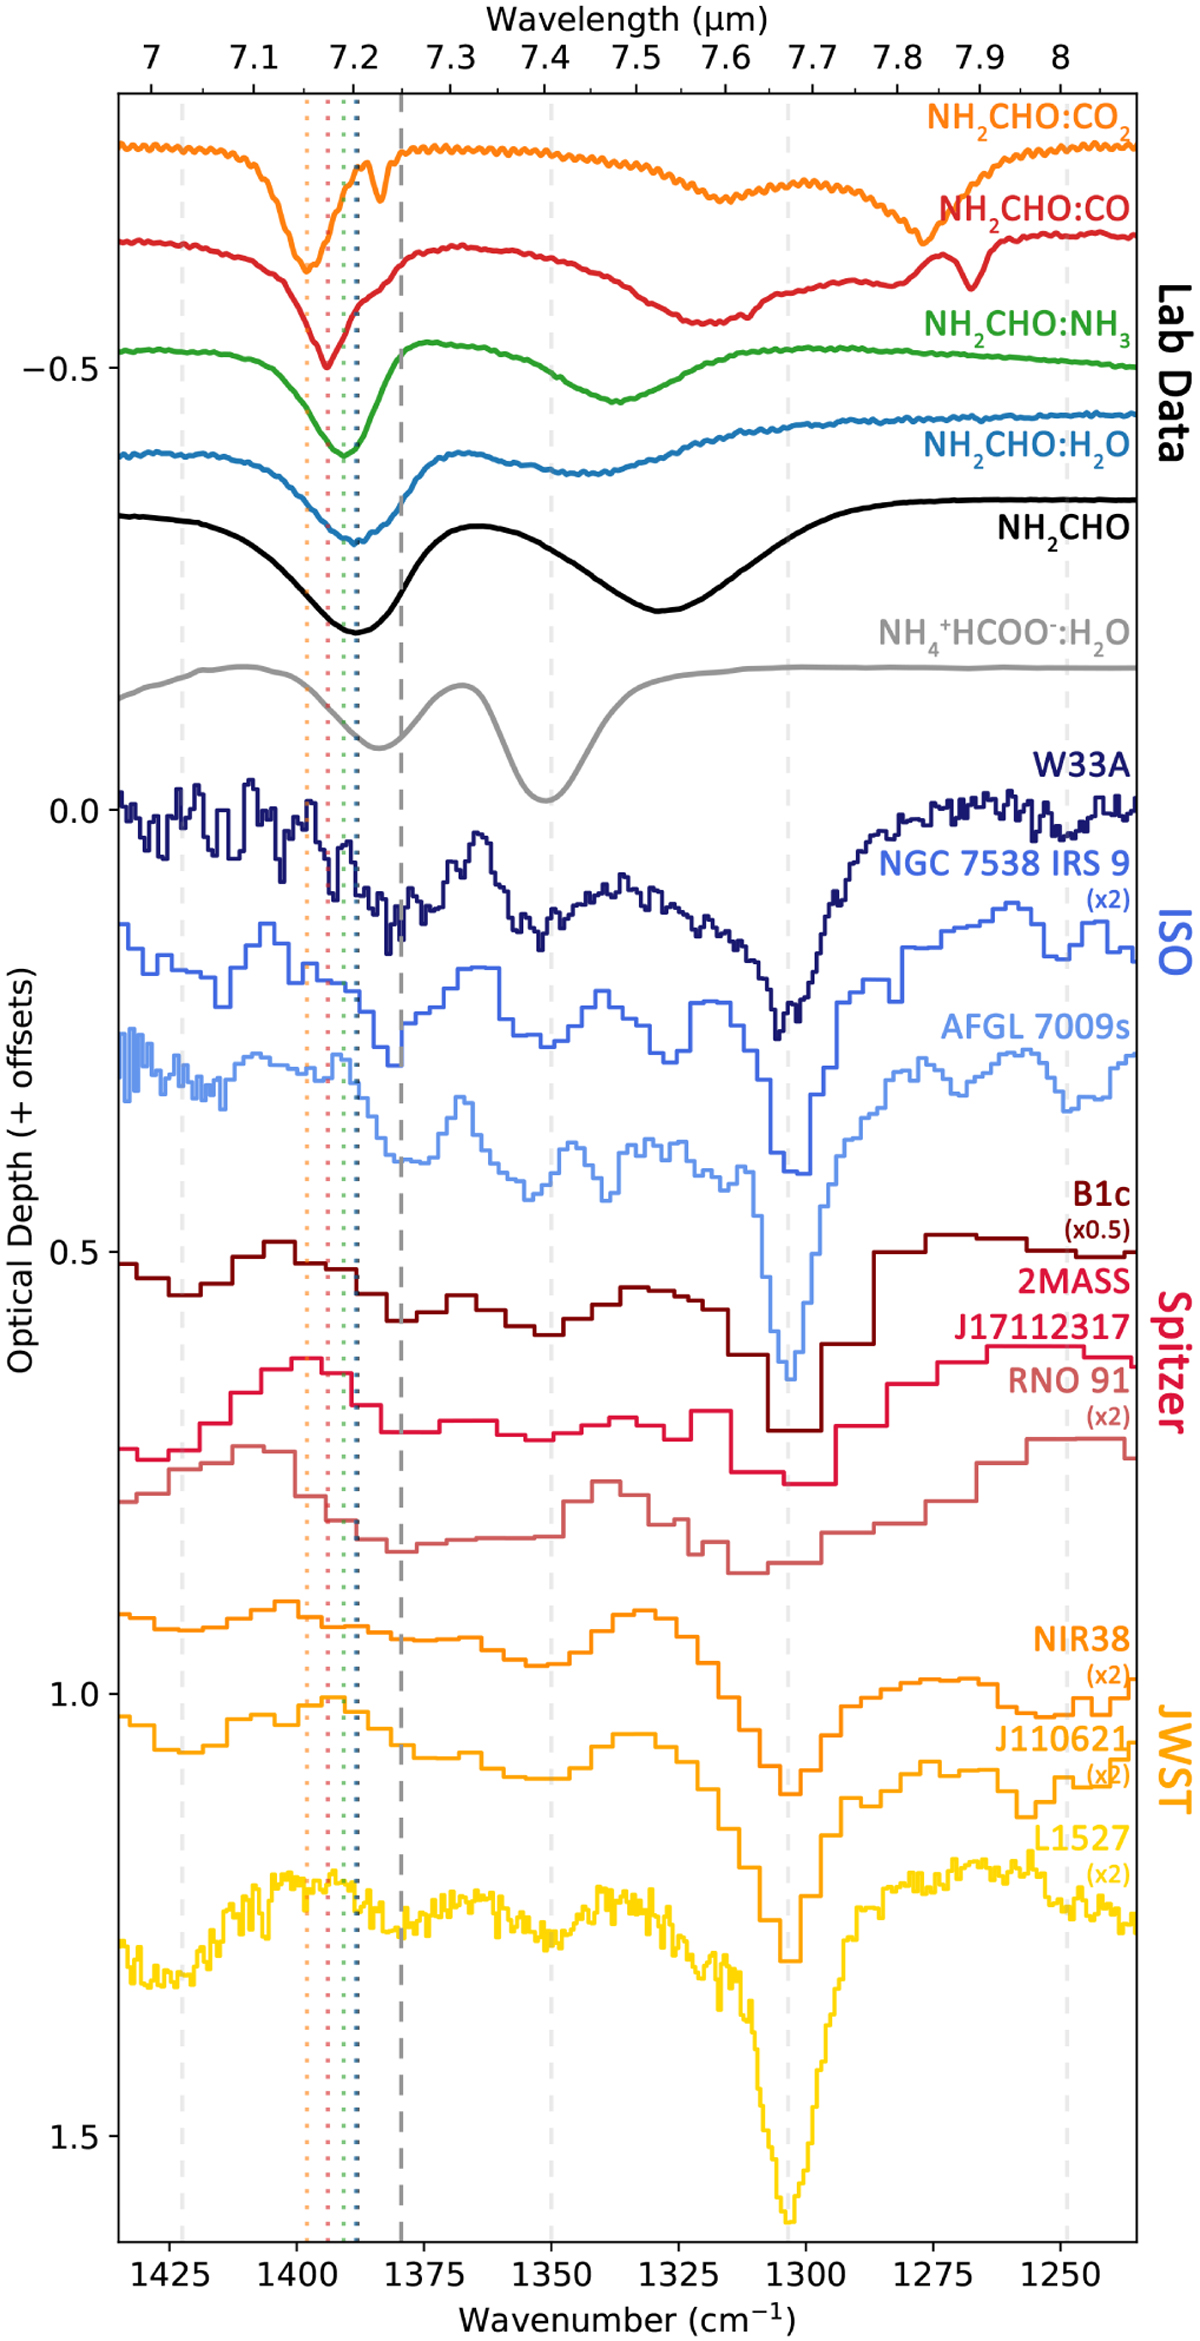
Laboratory spectra of several formamide mixtures (all at 15 K) as well as an ammonium formate:water mixture from Galvez et al. (2010; at 150 K) versus local continuum-subtracted ISO spectra of three MYSOs (in blue), Spitzer spectra of three LYSOs (in red), and JWST spectra of both cold dense clouds in front of background stars and a LYSO (in gold). Optical depth scaling factors (if applied) are indicated via labels under the source names. Several of the band positions marked by gray dashed lines have been tentatively assigned to various COMs. The darkest gray dashed line indicates the peak position of the 7.24 μm band, and the colored dotted lines correspond to the peak positions of the formamide CH bend in the plotted formamide spectra. The wavelength calibration of the MIRI-LRS spectra, NIR38 and J110621, is still uncertain and was done for these spectra locally via the CH4 band.
Current usage metrics show cumulative count of Article Views (full-text article views including HTML views, PDF and ePub downloads, according to the available data) and Abstracts Views on Vision4Press platform.
Data correspond to usage on the plateform after 2015. The current usage metrics is available 48-96 hours after online publication and is updated daily on week days.
Initial download of the metrics may take a while.