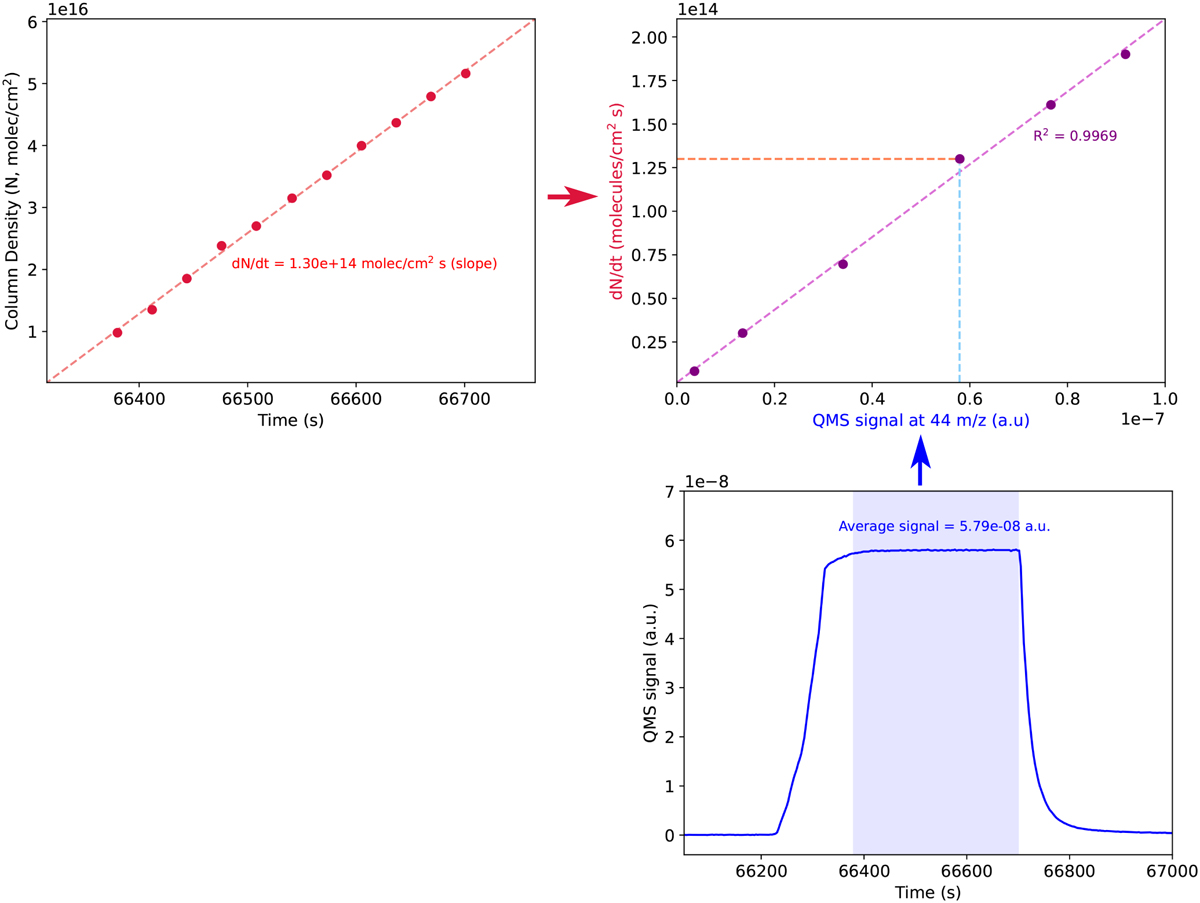
Fig. C.1
Download original image
Example of how a calibration curve is obtained, shown here for CO. The rate of ice growth is found via monitoring the molecule’s integrated absorbance of a selected peak, which can be converted to column densities via known pure band strengths, and relating them to the time of the spectrum collected (top left). Then the average value of a given mass signal (28 m/z for CO), measured by the QMS during the same time interval as the collection of the IR spectra, is calculated (bottom right). The calibration curve is obtained by correlating the two values to each other for a range of ice deposition rates (top right).
Current usage metrics show cumulative count of Article Views (full-text article views including HTML views, PDF and ePub downloads, according to the available data) and Abstracts Views on Vision4Press platform.
Data correspond to usage on the plateform after 2015. The current usage metrics is available 48-96 hours after online publication and is updated daily on week days.
Initial download of the metrics may take a while.