Fig. 9.
Download original image
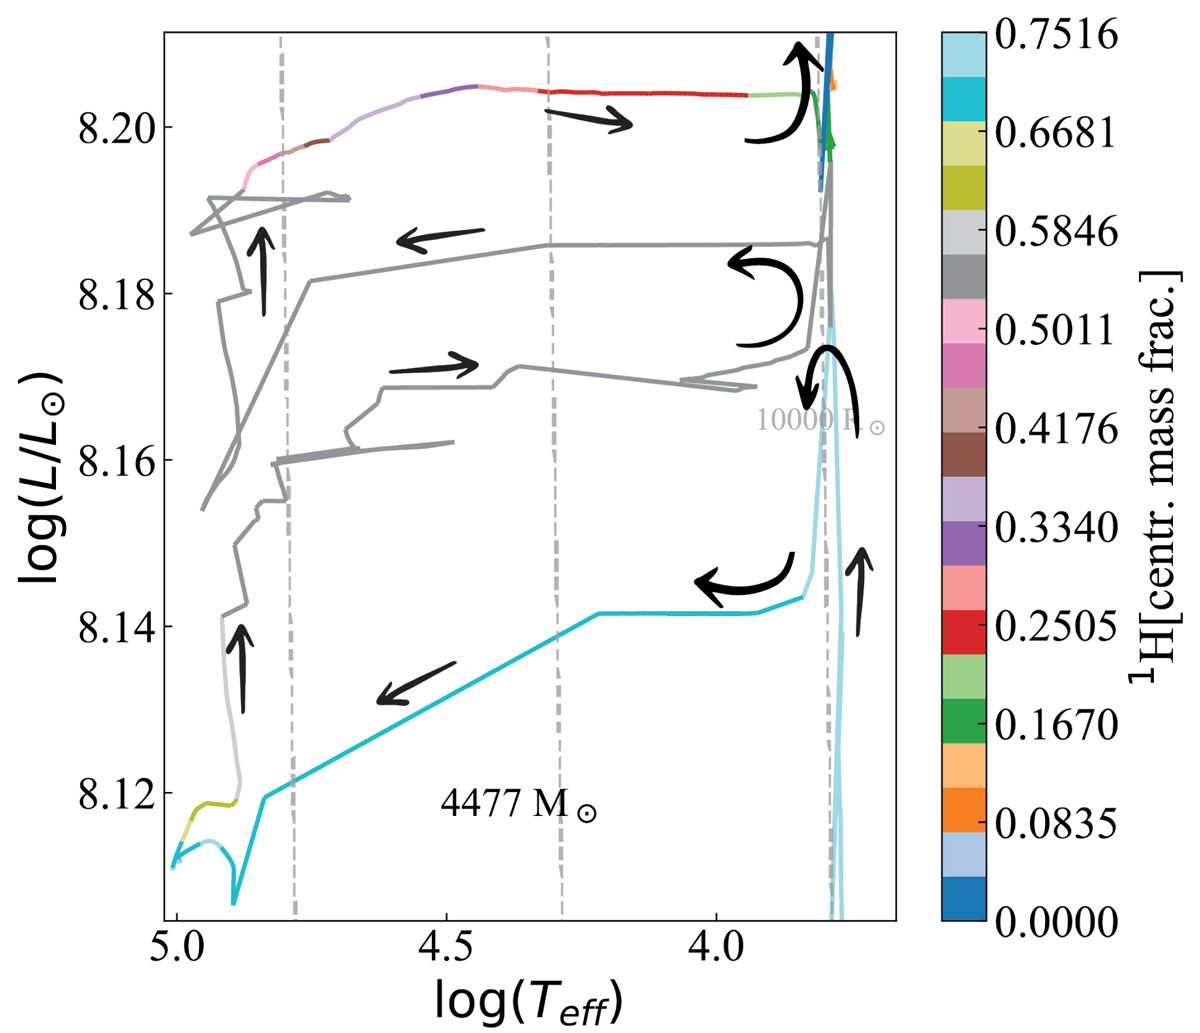
Magnified HR diagram of model 4477 (only the upper part is shown) depicting the migration between blue and red as a result of the variable accretion rate. The colour code follows the central mass fraction of hydrogen. The black arrows represent the evolutionary path taken by the model; the arrows emerge from the bottom right, which marks the pre-MS stage, and end at the top right, which denotes the end of the core hydrogen burning stage.
Current usage metrics show cumulative count of Article Views (full-text article views including HTML views, PDF and ePub downloads, according to the available data) and Abstracts Views on Vision4Press platform.
Data correspond to usage on the plateform after 2015. The current usage metrics is available 48-96 hours after online publication and is updated daily on week days.
Initial download of the metrics may take a while.