Open Access
Fig. 8.
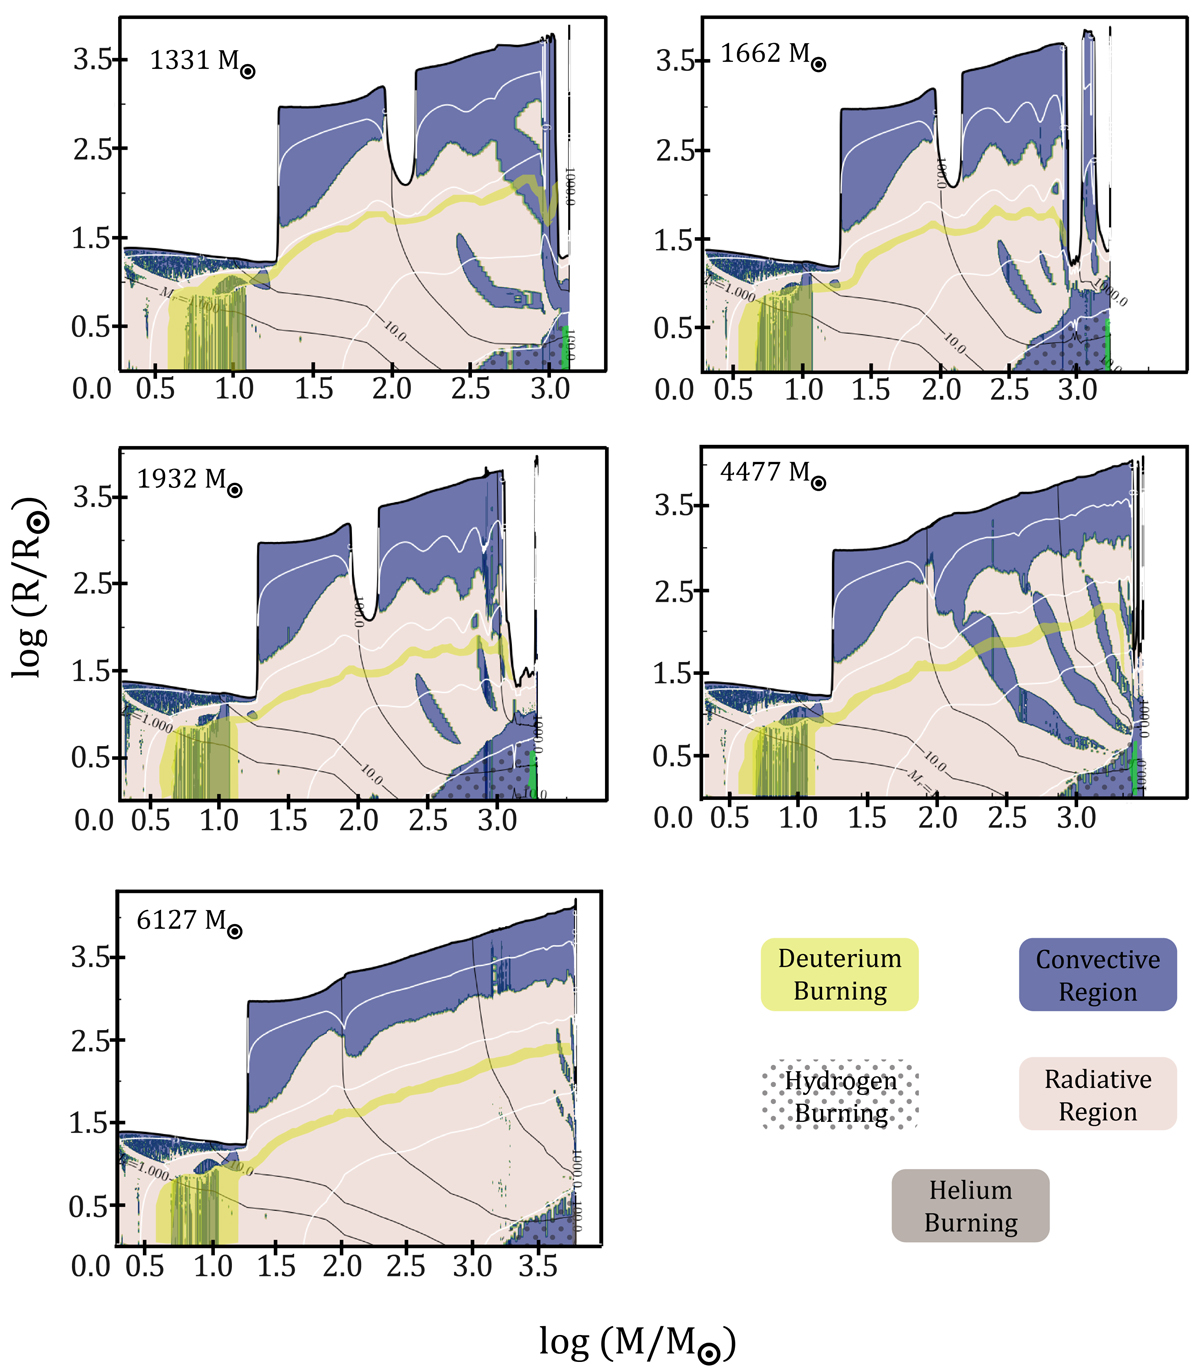
Download original image
Kippenhahn diagrams depicting the evolution of radius versus mass (both axes represented in log scale) for high mass models with mass 1331, 1662, 1923, 4477 and 6127 M⊙. The details of these diagrams are similar to Fig. 6.
Current usage metrics show cumulative count of Article Views (full-text article views including HTML views, PDF and ePub downloads, according to the available data) and Abstracts Views on Vision4Press platform.
Data correspond to usage on the plateform after 2015. The current usage metrics is available 48-96 hours after online publication and is updated daily on week days.
Initial download of the metrics may take a while.