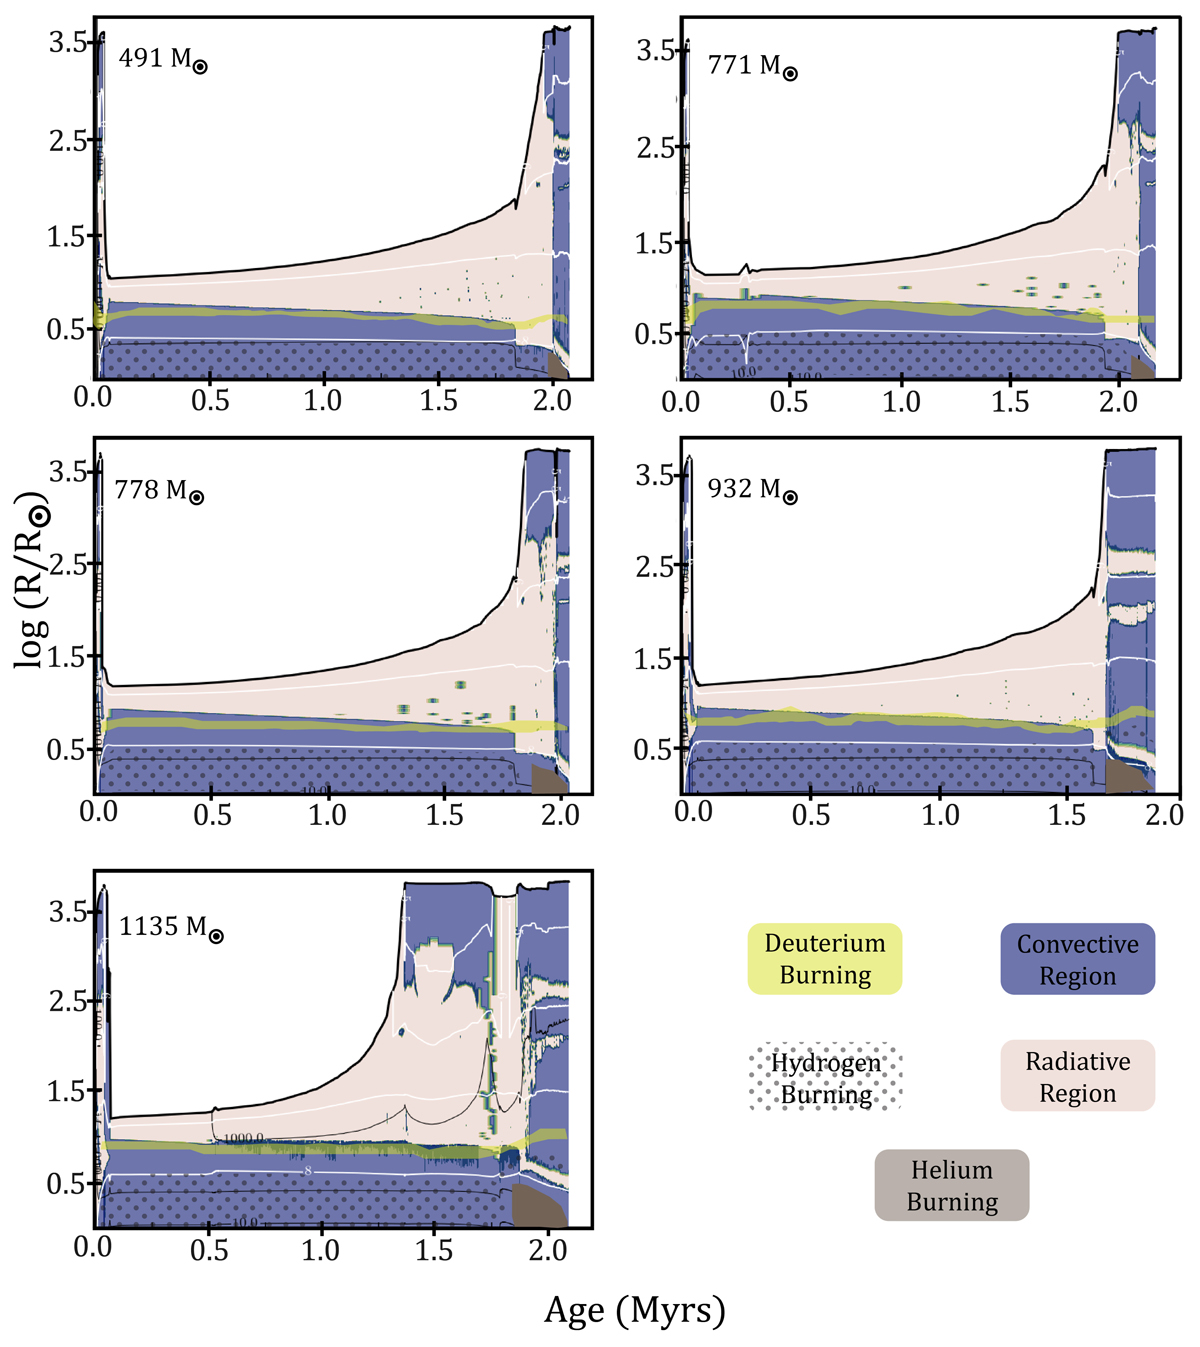
Fig. 5.
Download original image
Kippenhahn diagrams showing the evolution of the structure (in Eulerian coordinates) as a function of time (Myr) for the lowest-mass models. The blue and cream regions represent the convective and radiative zones, respectively. The iso-masses are depicted by black lines, whereas the isotherms of log(T[K]) = 5, 6, 7, and 8 are drawn in white lines. The translucent yellow regions show deuterium burning; dotted dark grey zones are hydrogen burning zones; and the dark grey zone highlights helium burning.
Current usage metrics show cumulative count of Article Views (full-text article views including HTML views, PDF and ePub downloads, according to the available data) and Abstracts Views on Vision4Press platform.
Data correspond to usage on the plateform after 2015. The current usage metrics is available 48-96 hours after online publication and is updated daily on week days.
Initial download of the metrics may take a while.