Fig. 4
Download original image
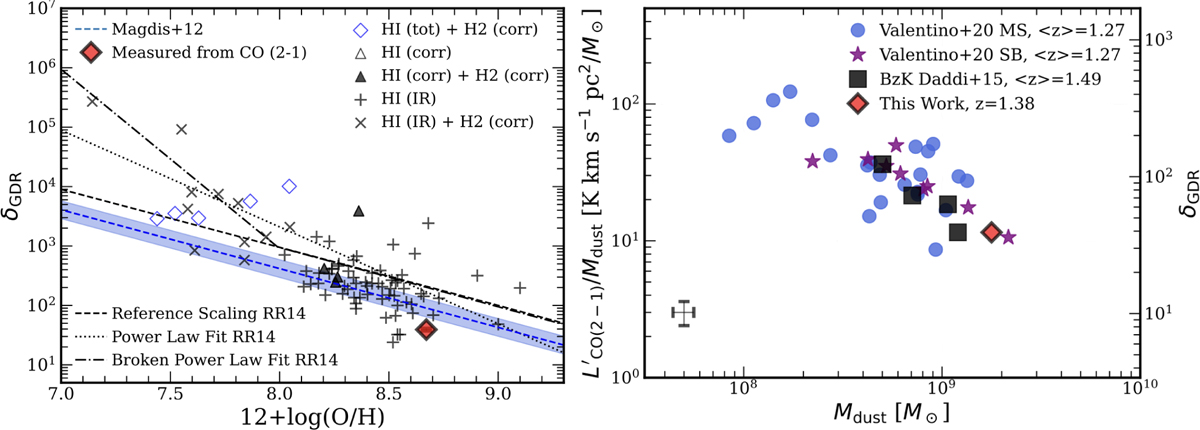
Gas-to-dust ratio and CO emission. Left: gas-to-dust ratio as a function of metallicity for the galactic CO to molecular gas conversion from Rémy-Ruyer et al. (2014, RR14). The dashed line represents the reference scaling of the δGDR with metallicity and the dotted and dash-dotted lines represent the best power-law and best broken power-law fits to the data presented in RR14. The dashed blue line with the shaded envelope show the δGDR – metallicity relation from Magdis et al. (2012) which we used to derive the original Mgas. The δGDR measurement from CO and dust continuum is shown as a red diamond. Right: CO(2−1) line luminosity to Mdust ratio and δGDR as a function of Mdust. For the δGDR, we assume αCO = 4.0 for all galaxies. We also show the sample of MS (blue) and SB (purple) galaxies from Valentino et al. (2020). The BzK galaxies from Daddi et al. (2015) are shown as black squares. Our galaxy is shown as a red diamond. A typical uncertainty on the data is shown in the bottom left corner.
Current usage metrics show cumulative count of Article Views (full-text article views including HTML views, PDF and ePub downloads, according to the available data) and Abstracts Views on Vision4Press platform.
Data correspond to usage on the plateform after 2015. The current usage metrics is available 48-96 hours after online publication and is updated daily on week days.
Initial download of the metrics may take a while.