Fig. 3
Download original image
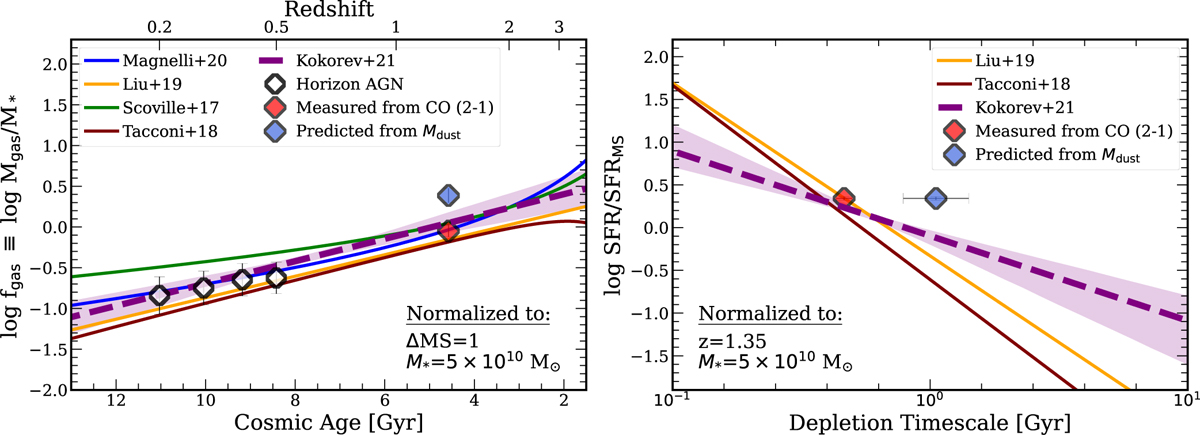
Evolution of ISM properties. Left: evolution of ƒgas as a function of z/cosmic age. Values of Mgas derived from Mdust, and CO J = 2→1 are shown as red and blue diamonds, respectively. Downward arrows denote upper limits. Solid colored lines correspond to empirical evolutionary trends derived in Scoville et al. (2017a), Tacconi et al. (2018), Liu et al. (2019), Magnelli et al. (2020). The dashed purple line shows the fit to the COSMOS Super Deblended catalog data, as described in Kokorev et al. (2021), with shaded purple region denoting the 16th and 84th percentile confidence intervals. Both the data and the derived relations have been re-scaled to ∆MS = 1 and M* = 5 × 10¹⁰ M⊙. White diamonds show median positions of the Horizon AGN star-forming galaxies at that redshift (Laigle et al. 2019), normalised in the same way as our data. Right: change in the distance to the main-sequence as a function of depletion time (τ). Labels and lines are the same as on the first panel.
Current usage metrics show cumulative count of Article Views (full-text article views including HTML views, PDF and ePub downloads, according to the available data) and Abstracts Views on Vision4Press platform.
Data correspond to usage on the plateform after 2015. The current usage metrics is available 48-96 hours after online publication and is updated daily on week days.
Initial download of the metrics may take a while.