Fig. 2
Download original image
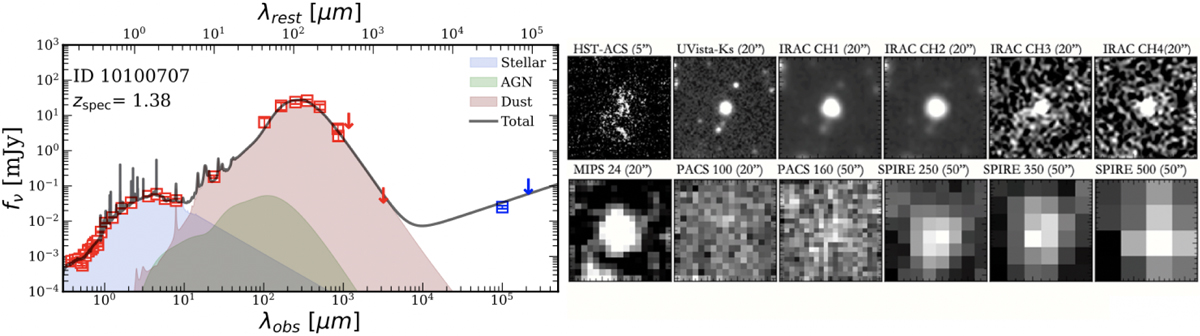
Best-fit SED and cutouts for our source. Left: multi-component template STARDUST spectrum (grey line and shaded areas), the observed photometry (red squares), including the upper limits (red arrows) are also displayed. Radio measurements from VLA at 1.4 (Schinnerer et al. 2010) and 3 GHz (Smolčić et al. 2017) are overlaid in blue. The SED is separated into three components – stellar emission (blue), AGN emission (green), dust (red). Right: optical-NIR-FIR cutouts of our galaxy, ranging from 5″.0 in the optical-MIR range to 50″.0 in FIR.
Current usage metrics show cumulative count of Article Views (full-text article views including HTML views, PDF and ePub downloads, according to the available data) and Abstracts Views on Vision4Press platform.
Data correspond to usage on the plateform after 2015. The current usage metrics is available 48-96 hours after online publication and is updated daily on week days.
Initial download of the metrics may take a while.