| Issue |
A&A
Volume 677, September 2023
|
|
|---|---|---|
| Article Number | A165 | |
| Number of page(s) | 6 | |
| Section | Planets and planetary systems | |
| DOI | https://doi.org/10.1051/0004-6361/202346837 | |
| Published online | 22 September 2023 | |
Cloud reflection modelling for impact flashes on Jupiter
A new constraint on the bulk properties of the impact objects
1
The Hakubi Center/Astronomical Observatory, Graduate School of Science, Kyoto University Kitashirakawa-oiwake-cho,
Sakyo-ku, Kyoto
606-8502, Japan
e-mail: This email address is being protected from spambots. You need JavaScript enabled to view it.
2
Department of Natural Science, Faculty of Science and Engineering, Tokyo City University,
1-28-1, Tamazutsumi, Setagaya,
Tokyo
158-8557, Japan
3
Institute of Space and Astronautical Science (ISAS), Japan Aerospace Exploration Agency (JAXA),
3-1-1 Yoshinodai, Chuo-ku, Sagamihara,
Kanagawa
252-5210, Japan
4
Public Relations center, National Astronomical Observatory of Japan 2-21-1 Osawa,
Mitaka,
Tokyo
181-8588, Japan
Received:
8
May
2023
Accepted:
28
July
2023
Abstract
Aims. We investigate the optical characteristics of flashes caused by the impact of metre- to decametre-sized outer Solar System objects on Jupiter, and the contributions of reflected light from surface clouds at visible wavelengths, in order to estimate more accurate bulk parameters, such as the luminous energy of the flash, the kinetic energy, the mass, and the size of the impact object.
Methods. Using the results of recent reflectivity studies of the Jovian surface, we developed a cloud reflection model that calculates the contribution of the reflected light relative to that directly from the flash. We compared the apparent luminous energy of the previously reported flashes with the expected cloud reflection contributions to obtain their revised bulk parameters.
Results. We find that cloud reflection contributions can make up to 200% of the flux directly from the flash, and thus can be the most significant uncertainty in the measurement of the bulk parameters. The reflection contributions strongly depend on wavelength. With our cloud reflection correction, we obtained revised bulk parameters for the previously reported flashes.
Conclusions. Our cloud reflection correction enables us to better understand the properties of objects impacting Jupiter and is crucial for ongoing detailed investigations using high-sensitivity and multi-wavelength observation systems, such as PONCOTS. It will also be useful for understanding other optical transients in Jupiter’s upper atmosphere, such as the recently discovered sprite-like events.
Key words: planets and satellites: atmospheres / planets and satellites: individual: Jupiter / meteorites, meteors, meteoroids / Kuiper belt: general
© The Authors 2023
 Open Access article, published by EDP Sciences, under the terms of the Creative Commons Attribution License (https://creativecommons.org/licenses/by/4.0), which permits unrestricted use, distribution, and reproduction in any medium, provided the original work is properly cited.
This article is published in open access under the Subscribe to Open model. This email address is being protected from spambots. You need JavaScript enabled to view it. to support open access publication.
1 Introduction
Since the first discovery by Hueso et al. (2010), second-timescale optical flashes on Jupiter have been serendipitously detected by ground-based amateur observers. Previous studies by Hueso et al. (2010, 2013, 2018) and Sankar et al. (2020) carried out photometric analyses of the recorded video data and investigated their emission characteristics. The optical energy estimates based on the photometric analyses indicate that the observed flashes are due to the impact of unidentified interplanetary objects with sizes in the metre-to-decametre range. Their energy estimates therefore provide a unique opportunity to study the abundance and physical properties of small objects in the outer Solar System. Furthermore, the emission properties of the Jovian flashes provide the radiation characteristics of large impacts on atmospheres, which could potentially threaten human society (Jenniskens et al. 2019; Boslough & Crawford 1997, Boslough & Crawford 2008), but which are still unknown due to their infrequent occurrence on Earth (Brown et al. 2002).
Unlike lunar impact flashes, which occur on the solid surface of the Moon (e.g. Ortiz et al. 2000; Avdellidou & Vaubaillon 2019), the impact flashes of planets with substantial atmospheres, such as Jupiter, occur in the stratosphere (Sankar et al. 2020). The Jovian flashes illuminate the surfaces of the Jovian upper clouds at ~600 mbar. These clouds are approximately 30–50 km below the illumination source, and reflections of light from them can contaminate the observed emission (Borovička & Charvát 2009). In the previous impact flash studies by Hueso et al. (2013, 2018), the contribution of the cloud reflection component was corrected with a constant correction factor. This “classical” correction method is useful for order-of-magnitude estimates of the bulk properties (energy, mass, and size) of the flashes. However, this method may become insufficient for recent and near-future multispectral and high-precision photometric studies, because the real contribution of the cloud reflection can strongly depend on the wavelength and the geometric arrangement of the observations, expressed as the emission angle, which is the angle between the zenith of the Jovian impact site and the observer (e.g. Li et al. 2018).
A recent impact flash on Jupiter was detected by an optical observation system dedicated to the Jovian flashes, the Planetary ObservatioN Camera for Optical Transient Surveys (PONCOTS; Arimatsu et al. 2022, 2023) on 15 October 2021. As PONCOTS is a multi-band optical high-cadence imaging observation system, three-wavelength high-cadence images of the Jovian flash were obtained for the first time. These three-band images were calibrated with a spectrophotometric standard star and provide a photometric record of the Jovian flash with unprecedented precision. The obtained spectral energy distributions (SEDs) show a strong excess feature in wavelength bands where a significant cloud reflection is expected (Arimatsu et al. 2022; see also Sect. 3.1). Detailed analyses of Jovian flashes using multi-wavelength data sets therefore require modelling and investigation of the wavelength and emission angle-dependent cloud contributions. The recent development of high-cadence multi-band instruments dedicated to flash observations, such as PONCOTS, and the improvement in the sensitivity of industrial CMOS sensors adopted by amateur observers (e.g. Arimatsu et al. 2017, 2019), will enable more frequent multi-band detections of Jovian flashes. The demand for appropriate modelling of cloud reflections is expected to increase even more in the near future.
In this paper, we propose a new cloud reflection model that takes into account the wavelength and emission angle dependence of reflectivity, and we investigate the contributions of the cloud reflection component to the observed flash brightnesses. Recent studies of global images of Jupiter taken by the Cassini spacecraft have succeeded in producing a precise multi-wavelength phase curve model of the Jovian surface (Li et al. 2018; Heng & Li 2021). These results provide an unprecedented opportunity to understand the characteristics of cloud reflection and to develop an alternative reflection model sufficient for more detailed flash analyses. We also present the results of applying our proposed cloud reflection model to the previously reported Jovian impact flashes to demonstrate the importance of accurately correcting for the cloud reflection component in impact flash analyses. In Sect. 2, we present our proposed cloud reflection model. The results and a discussion of the application of the cloud reflection model to our 2021 flash detections and the other previous studies are presented in Sect. 3. Finally, the results and discussions are summarised in Sect. 4.
2 Cloud reflection model
Impact flash radiation reflected from Jupiter’s upper clouds can contribute to the observed flux, Fobs. To obtain the corrected flux, Fcor, we derived a cloud-reflectivity contribution factor, fCR, given by
 (1)
(1)
where fCR is the ratio of the observed flux from the cloud reflection to that directly from the source. The previous studies by Hueso et al. (2013, 2018) used a constant correction factor for the cloud reflection of fCR = 0.3 under simple and intuitively acceptable assumptions; almost 50% of the light from a flash illuminates the Jovian upper clouds and is reflected with an approximate albedo of ~0.5. However, the observed reflected light comes from an entire surface area illuminated by the flash and can be stronger than the emission directly from the emission source.
In our modelling, we assumed that the Jovian clouds reflect light as a Lambertian surface. We considered a radiation source at height, h, above flat clouds distributed on a x–y plane (Fig. 1). With the isotropic source intensity per unit solid angle, I0, and the reflected power radiated, ΔICR(μ), at the emission angle, cos−1 μ, fCR is given by fCR = ΔICR(μ)/I0. The incident light per unit surface area at (x, y, 0) is μ0I0/(x2 + y2 + h2), where μ0 is the cosine of the incidence angle, i.e.  . If we assume the Lambertian reflectance of the Jovian surface with Lambertian albedo pL, the cloud reflection component, ΔICR(μ), is given with a radial distance from (0,0,0), i.e.
  ,
,
by
 (2)
(2)
 (3)
(3)
 (4)
(4)
 (5)
(5)
where pg is a geometric albedo with the relation pg = (2/3) pL for a Lambertian sphere. fCR is thus expected to be up to around three times the geometric albedo. According to recent Jovian reflectivity studies by Li et al. (2018), pg reaches its maximum value of pg ~ 0.65 at an optical wavelength range of λ = 500–700 nm. fCR can therefore be up to ~3 × 0.65 ~ 2 at μ ~ 1.
In reality, the reflectivity of the Jovian surface clouds depends strongly on the reflection angle and the observed wavelength (e.g. Li et al. 2018). The reflected component is maximised for low latitude impacts near the central meridian and drops to zero for those at the limb. We then derived ΔICR(λ, μ) relative to I0(λ) based on data sets of the wavelength-dependent Jovian surface reflection phase functions obtained by Li et al. (2018) and Heng & Li (2021). The ΔICR(λ,μ) was estimated by integrating the light rays from the source, I0(λ), reflected by each surface element of the clouds with incidence (cos−1 μ0), emission (cos−1 μ), and phase (α) angles as follows:
 (6)
(6)
where Ρ(α) is the phase function and H(μ) is the Chandrasekhar H-function representing multiple isotropic scattering, which satisfies the following integral equation:
 (7)
(7)
where ω is a single-scattering albedo.
For the phase function, P(α), we used the Double Henyey-Greenstein (DHG) scattering phase functions given by
 (8)
(8)
where g1 and g2 are scattering asymmetry factors and f is a fractional factor for each Henyey-Greenstein function. These parameters (g1, g2, f, and ω) for the DHG functions have recently been estimated by Heng & Li (2021). They used reflected light phase curves of Jupiter derived from the multi-wavelength global images with different phase angles taken by the Cassini spacecraft. The four DHG parameters as a function of wavelength are shown in Fig. 2. The derived ΔICR/I0 as a function of λ for different emission angles, cos−1 μ, is shown in Fig. 3. For cos−1 μ = 0 (μ = 1), ΔICR/I0 becomes up to around two at λ ~ 500–700 nm, where pg reaches a maximum value (Li et al. 2018). This maximum is roughly in agreement with that expected from the isotropic reflectivity model (fCR ~ 3 × pg ~ 2 at μ ~ 1; see Eq. (5)) but approximately an order of magnitude larger than the previous assumption (fCR ~ 0.3; Hueso et al. 2013, 2018). Even for smaller μ cases (cos−1 μ < 80°), ΔICR/I0 is larger than 0.3 in most wavelength ranges. On the other hand, ΔICR/I0 is smaller than 0.3 for μ = 0–1 at λ ~ 890 nm, where a strong methane absorption band is present, and pg is exceptionally low (e.g. Karkoschka 1994; Karkoschka & Tomasko 2010).
The present model assumes an infinite illumination area of a flat surface and may overestimate the intensity of the reflection component because a real flash of finite height illuminates a finite area within the visible horizon due to the curvature of the Jovian surface. It is difficult to make an accurate estimate of the flash height from the observed light curve, which depends strongly on the material properties of the impact object. According to the previous simulation results of the observed Jovian flashes (Sankar et al. 2020; Arimatsu et al. 2023), the typical height of the flashes above the cloud surface is estimated to be 20 km or more. Assuming the lower limit of the flash height to be 20 km, ΔICR/I0 is up to 2% smaller than that derived from our original model calculation. This difference can lead to underestimation of Fcor of up to 1% in the present calculation and is negligible in the present studies.
The present model also ignores the finite size of the flash radiation area, which can have a non-negligible effect on the reflection component calculations. Based on the typical luminosity, L (L ~ a few of 1014 W or less, Hueso et al. 2018), and the effective temperature, T (T = 6500–10 000 K, Hueso et al. 2010; Giles et al. 2021b; Arimatsu et al. 2022), of the previously observed Jupiter flashes, the total effective area emitting the radiation is approximated to be L/(σ T4), where σ is the Stefan-Boltzmann constant, and derived to be ≲3 km−2. Assuming the radiation source is sphere-like, its typical scale is therefore ≲ 1 km, which is one to two orders of magnitude smaller than the typical height of the flash. The observed flash can thus be approximated as a point-like source for typical cases.
fCR for each observation is obtained by integrating ΔICR/I0 over wavelengths as follows:
 (9)
(9)
where R(λ) is the system response of an observation instrument at wavelength λ.
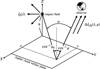 |
Fig. 1 Notation used in the present study. |
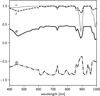 |
Fig. 2 DHG parameters used in the present study as a function of wavelength derived by Heng & Li (2021). Scattering asymmetry factors, g1 and g2, the weighting factor, f, and the single-scattering albedo, ω, are shown as solid, dot-dashed, dashed, and dotted lines, respectively. |
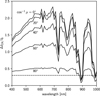 |
Fig. 3 ΔICr(μ)/I0 as a function of wavelength for different emission angles, cos−1 μ. The horizontal dashed line represents a fCR value used for previous studies (fCR = 0.3; Hueso et al. 2013, 2018). |
3 Results and discussion
3.1 Applications of the reflection model to the October 2021 flash event (PONCOTS flash)
On 15 October 2021, a bright optical flash was detected with the PONCOTS observation system (Arimatsu et al. 2022), which is dedicated to observing Jovian impact flashes. PONCOTS observed the flash simultaneously in three different wavebands, V, Gh, and CH4, which have effective wavelengths of 505–650, 680–840, and 880–900 nm, respectively (Fig. 4a). As mentioned in Arimatsu et al. (2022), the three band fluxes obtained with PONCOTS were calibrated using the present cloud reflection model.
Figure 4b shows an example of the application of the cloud reflection correction to the observed PONCOTS flash SEDs. The observed fluxes (crosses in Fig. 4b) show a strong excess in the V and Gh bands relative to the CH4 band. Without the spectral-dependent correction for cloud reflections, single or multiple-temperature blackbody spectral models cannot be fitted to the observed SED because its spectral slope is steeper than that of Rayleigh-Jeans. With our cloud reflection model, fCR at μ = 0.91 (the emission angle for the PONCOTS flash) for the PONCOTS V, Gh, and CH4 bands were estimated to be 1.9, 1.7, and 0.4, respectively. After subtracting the cloud reflection contributions, the apparent excess in the SED disappeared (points with error bars in Fig. 4). A single-temperature black-body radiation spectral model approximated the corrected SED well with a best fit temperature of ~8300 K (Arimatsu et al. 2022). The total luminous energy, E0, was obtained from the SED fit results:  J. The total kinetic energy, ET, was derived from E0 using the relationship taken from Brown et al. (2002),
 (10)
(10)
 (11)
(11)
where η is the optical luminous energy efficiency, and ET and E0 are in kilotons of TNT (kt; 1 kt = 4.19 × 10¹² J). For the PONCOTS flash, ET was derived as  . Since the impact velocity, v0, of the impact object was assumed to be comparable with the escape velocity of Jupiter (Harrington et al. 2004), i.e. v0 ≃ 60 km s−1, the mass of the impact object, M0, was given with ET by M = 2
  . Assuming its spherical shape, the diameter of the object, D, is described with a volume density, ρ, as D = (6 Μ/(π ρ))1/3. In this study, ρ is assumed to be ρ = 600 kg m−3 for reference, and D is then derived as
  . The obtained bulk parameters are tabulated in Table 1.
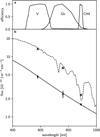 |
Fig. 4 Example of the cloud reflection correction results of the 2021 October impact flash (PONCOTS flash) data. (a) Relative spectral responses of the three PONCOTS bands, V, Gh, and CH4. (b) A SED obtained during the peak phase of the flash, overlaid with its cloud correction results and the best-fit model spectrum. Crosses and points with error bars represent observed fluxes and those after cloud-reflection correction, respectively. The best-fit spectrum of single-temperature blackbody radiation with a best-fit temperature of 8300 K is shown as the solid line. The dashed line corresponds to the expected total observed flash spectrum, including the cloud reflection contribution. |
3.2 Applications of the reflection model to the previously reported flash events
As of April 2023, seven flashes, including the PONCOTS flash, have been detected by ground-based optical instruments and reported in previous studies. This subsection provides a brief review of the previously reported flashes and demonstrates the importance of our developed cloud reflection model for the bulk properties of their impact objects. As noted in Sect. 1, the contribution of the cloud reflection component has been corrected with a constant correction factor in the previous flash studies. It should be noted that the previous approximation provides sufficient accuracy for order of magnitude estimates of the bulk properties of the impact objects. On the other hand, applications of our reflection model to the previous flash events should provide opportunities to demonstrate how the cloud reflection contribution dominates the observed flash brightness and is of great importance for more detailed studies of impact objects.
Table 1 summarises the results of the re-analysis of the previously reported flashes. Our revised fCR values are significantly larger than that previously assumed (fCR ~ 0.3), and corrected the E0, ET, and M values of the flashes by up to a factor of two. Since D is proportional to M1/3, our cloud reflection correction does not significantly change the impact size estimation results (up to ~30% of the original values) or the conclusions of the previous impact size frequency studies (Hueso et al. 2013, 2018). On the other hand, this size correction implies that the frequency of very large impacts leaving observable debris fields in the Jovian atmosphere would be lower than previously thought (0.4–2.6 events yr−1; Hueso et al. 2018). In fact, the PONCOTS flash is estimated to be the largest impact observed since 2010, and it was not large enough to leave a debris field in the high-resolution images of the area obtained with the JunoCam instrument on board the Juno spacecraft about 28 h after the impact (Arimatsu et al. 2022).
The diameter of the PONCOTS flash object ( ) is approximately two times larger than that of the second largest impact (the March 2016 impact; D = 10–13 m) and 2.6 times larger than the average diameter of the other six impacts (D ~ 9.0 m). It is interesting to note that the ratio of the number of impact objects, N, with D ≳ 23.5 m to those with D ≳ 9.0 m class impacts (1/7 ~ 0.14) is consistent with that expected from the size distribution typically assumed for Jupiter family comets impacting Jupiter (N(≳ 23.5 m)/N(≳ 9.0 m) = (23.5/9.0)−2 ~ 0.15; e.g. Levison et al. 2000). The details of each impact event are presented as follows.
3.2.1 June 2010 flash
On 3 June 2010, the first impact flash event on Jupiter was discovered by two amateur astronomers, as reported by Hueso et al. (2010). They observed the same flash at different wavelength bands, which had an effective wavelength of λ = 435 nm (hereafter “B-band”) and 650 nm (“R-band”), respectively. The previous E0 and ET values were estimated by Hueso et al. (2013) to be E0 = 0.3−2.7 × 10¹⁴ J and ET = 1.9–14 × 1014 J, respectively, assuming the cloud correction factor to be fCR = 0.3 and a blackbody flash radiation with a temperature range of 3500–10 000 K. Using the emission angle for this event (μ = 0.62) and the system responses for the two observations provided by Hueso et al. (2013), we found fCR for the B- and R-bands to be fCR ~ 1.2 and fCR ~ 1.4, respectively, corresponding to Fcor = 0.45 and 0.42, approximately 40–50% smaller than the previously assumed Fcor ~ 1/1.3. Since fCR for each wavelength band depends on the spectrum of the flash, it varies with the assumed effective temperature. However, the variation of fCR is less than 10% in the assumed temperature range (3500–10000 K). With the fCR, we re-scaled E0 for each band and obtained its upper and lower limits. We then derived the revised ET, M, and D using the relationships presented in Sect. 3.1. The obtained upper- and lower-limit values for the bulk parameters are E0 = 2–17 × 1013 J, ET = 1.1–8.9 × 10¹⁴ J, and D = 5.8–12 m, which are approximately 70%, 60%, and 20% smaller than the previous estimate, respectively.
(Re-)analysis results of the Jovian impact flashes using our cloud reflection model.
3.2.2 August 2010-May 2017 flashes
Hueso et al. (2013, 2018) reported five impact flash events detected between 2010 and 2017, four of which are newly reported. From the five reported detections and their estimated sizes of the impact objects, they performed order-of-magnitude estimates of the impact rates of metre- to decametre-sized outer Solar System bodies on the Jovian surface. In these studies, they used a constant fCR = 0.3, except for the March 2016 event, which occurred close to the Jovian limb and in which the contribution of the cloud reflection was not expected.
We estimated fCR for each detection case using our cloud reflection model and derived the revised bulk parameters, which are presented in Table 1. The assumed temperature ranges for the deviations of E0 and ET were 3500–10 000 K for the August 2010 and September 2012 cases and 3500-8500 K for the March 2016 and May 2017 cases, respectively, following Hueso et al. (2013, 2018). As in the case of the June 2010 flash, the revised E0 and ET for these flashes are up to ~50% smaller than the previous estimates due to underestimations of the cloud reflection contributions. On the other hand, the revised D values are up to ~20% smaller than the original ones and therefore do not significantly change the previous results of the impact size frequency studies.
3.2.3 August 2019 flash
Another impact flash event on 7 August 2019 was reported by Sankar et al. (2020). Since the single wavelength movie data of this event were recorded with better image quality than the previous ones, the luminous and kinetic energies were obtained with small uncertainties under an assumed effective temperature range of 3500–10 000 K. With the contribution factor fCR ~ 1.4, E0 and ET were corrected to be 0.4–0.6 × 10¹⁴ and 2.4–3.8 × 10¹⁴ J, respectively, which is approximately a factor of two smaller than the original values. In contrast to the detection cases presented above, these corrected energy ranges are outside the uncertainty ranges of the original values.
4 Conclusions
The cloud reflection component can account for up to 70% of the observed flash brightness, and its fraction varies strongly with the observation geometry. The application of our proposed correction method to the previously reported flashes provides revised bulk parameters for the impact objects. These revised parameters do not significantly affect the discussion of the impact object sizes raised in previous studies. However, the proposed cloud reflection correction will be critical for more detailed ongoing investigations, including present-day ablation and fragmentation modelling of the flashes observed with current high-sensitivity and multi-wavelength systems such as PONCOTS. In addition, the application of the present correction method to the ultraviolet (UV) spectrum of the impact flash recently obtained with the Ultraviolet Spectrograph instrument on board the Juno spacecraft (Giles et al. 2021b) may influence discussions of its emission characteristics. However, the reflection component in the UV wavelength range is expected to be much weaker than that in the visible range due to the low UV reflectivity of the Jovian surface clouds (e.g. Giles et al. 2021a). Further discussion will require additional detailed modelling of the reflection component, taking into account the UV reflective properties.
It should be noted that the exact evaluation of the reflection component is a more complex problem of three-dimensional radiative transfer and requires consideration of spatial variations of the optical properties of Jovian clouds. Although the present model is still a kind of simple approximation and therefore imperfect, it provides a practical method for deriving the most appropriate contribution factors with limited observational and computational resources. Most of the recent Jovian flashes have been observed with Bayer filter colour cameras or multi-band imaging instruments (Hueso et al. 2018; Arimatsu et al. 2022). The spatially resolved surface colour information obtained simultaneously with these instruments would be a key to understanding a more detailed reflection characteristic of the impact site.
In addition to the impact flash studies, our reflection model will be useful for understanding other optical transients of the Jovian upper atmosphere, such as the sprite-like events recently discovered by Giles et al. (2020). Non-negligible contributions from the cloud reflection components must be present in such observed transients. The present model is therefore expected to have a broader application to optical transients occurring on the Jovian surface.
Acknowledgements
We thank Ricardo Hueso for his impartial review and for providing constructive suggestions. We thank Erich Karkoschka for providing the data on the methane absorption model, and Liming Li for providing the data on the phase-angle dependence of the Jovian albedo. This research has been partly supported by JSPS grants (18K13606, 21H01153).
References
- Arimatsu, K., Tsumura, K., Ichikawa, K., et al. 2017, PASJ, 69, 68 [CrossRef] [Google Scholar]
- Arimatsu, K., Tsumura, K., Usui, F., et al. 2019, Nat. Astron., 3, 301 [NASA ADS] [CrossRef] [Google Scholar]
- Arimatsu, K., Tsumura, K., Usui, F., & Watanabe, J.-I. 2022, ApJ, 933, L5 [NASA ADS] [CrossRef] [Google Scholar]
- Arimatsu, K., Tsumura, K., Usui, F., & Watanabe, J.-I. 2023, MNRAS, 522, 976 [NASA ADS] [CrossRef] [Google Scholar]
- Avdellidou, C., & Vaubaillon, J. 2019, MNRAS, 484, 5212 [NASA ADS] [CrossRef] [Google Scholar]
- Borovička, J., & Charvát, Z. 2009, A&AS, 507, 1015 [CrossRef] [EDP Sciences] [Google Scholar]
- Boslough, M. B. E., & Crawford, D. A. 1997, Ann. N. Y. Acad. Sci., 822, 236 [NASA ADS] [CrossRef] [Google Scholar]
- Boslough, M. B. E., & Crawford, D. A. 2008, Int. J. Impact Eng., 35, 1441 [NASA ADS] [CrossRef] [Google Scholar]
- Brown, P., Spalding, R. E., ReVelle, D. O., Tagliaferri, E., & Worden, S. P. 2002, Nature, 420, 294 [Google Scholar]
- Giles, R. S., Greathouse, T. K., Bonfond, B., et al. 2020, J. Geophys. Res. Planets, 125, e06659 [NASA ADS] [CrossRef] [Google Scholar]
- Giles, R. S., Greathouse, T. K., Hue, V., et al. 2021a, J. Geophys. Res. Planets, 126, e06928 [NASA ADS] [CrossRef] [Google Scholar]
- Giles, R. S., Greathouse, T. K., Kammer, J. A., et al. 2021b, Geophys. Res. Lett., 48, e91797 [NASA ADS] [CrossRef] [Google Scholar]
- Harrington, J., de Pater, I., Brecht, S. H., et al. 2004, in Jupiter. The Planet, Satellites and Magnetosphere, 1, eds. F. Bagenal, T.E. Dowling, & W.B. McKinnon, 159 [Google Scholar]
- Heng, K., & Li, L. 2021, ApJ, 909, L20 [NASA ADS] [CrossRef] [Google Scholar]
- Hueso, R., Wesley, A., Go, C., et al. 2010, ApJ, 721, L129 [NASA ADS] [CrossRef] [Google Scholar]
- Hueso, R., Pérez-Hoyos, S., Sánchez-Lavega, A., et al. 2013, A&A, 560, A55 [NASA ADS] [CrossRef] [EDP Sciences] [Google Scholar]
- Hueso, R., Delcroix, M., Sánchez-Lavega, A., et al. 2018, A&A, 617, A68 [NASA ADS] [CrossRef] [EDP Sciences] [Google Scholar]
- Jenniskens, P., Popova, O. P., Glazachev, D. O., Podobnaya, E. D., & Kartashova, A. P. 2019, Icarus, 327, 4 [NASA ADS] [CrossRef] [Google Scholar]
- Karkoschka, E. 1994, Icarus, 111, 174 [Google Scholar]
- Karkoschka, E., & Tomasko, M. G. 2010, Icarus, 205, 674 [NASA ADS] [CrossRef] [Google Scholar]
- Levison, H. F., Duncan, M. J., Zahnle, K., Holman, M., & Dones, L. 2000, Icarus, 143, 415 [NASA ADS] [CrossRef] [Google Scholar]
- Li, L., Jiang, X., West, R. A., et al. 2018, Nat. Commun., 9, 3709 [Google Scholar]
- Ortiz, J. L., Sada, P. V., Bellot Rubio, L. R., et al. 2000, Nature, 405, 921 [NASA ADS] [CrossRef] [Google Scholar]
- Sankar, R., Palotai, C., Hueso, R., et al. 2020, MNRAS, 493, 4622 [NASA ADS] [CrossRef] [Google Scholar]
All Tables
(Re-)analysis results of the Jovian impact flashes using our cloud reflection model.
All Figures
|
Fig. 1 Notation used in the present study. |
| In the text | |
|
Fig. 2 DHG parameters used in the present study as a function of wavelength derived by Heng & Li (2021). Scattering asymmetry factors, g1 and g2, the weighting factor, f, and the single-scattering albedo, ω, are shown as solid, dot-dashed, dashed, and dotted lines, respectively. |
| In the text | |
|
Fig. 3 ΔICr(μ)/I0 as a function of wavelength for different emission angles, cos−1 μ. The horizontal dashed line represents a fCR value used for previous studies (fCR = 0.3; Hueso et al. 2013, 2018). |
| In the text | |
|
Fig. 4 Example of the cloud reflection correction results of the 2021 October impact flash (PONCOTS flash) data. (a) Relative spectral responses of the three PONCOTS bands, V, Gh, and CH4. (b) A SED obtained during the peak phase of the flash, overlaid with its cloud correction results and the best-fit model spectrum. Crosses and points with error bars represent observed fluxes and those after cloud-reflection correction, respectively. The best-fit spectrum of single-temperature blackbody radiation with a best-fit temperature of 8300 K is shown as the solid line. The dashed line corresponds to the expected total observed flash spectrum, including the cloud reflection contribution. |
| In the text | |
Current usage metrics show cumulative count of Article Views (full-text article views including HTML views, PDF and ePub downloads, according to the available data) and Abstracts Views on Vision4Press platform.
Data correspond to usage on the plateform after 2015. The current usage metrics is available 48-96 hours after online publication and is updated daily on week days.
Initial download of the metrics may take a while.