Fig. 4
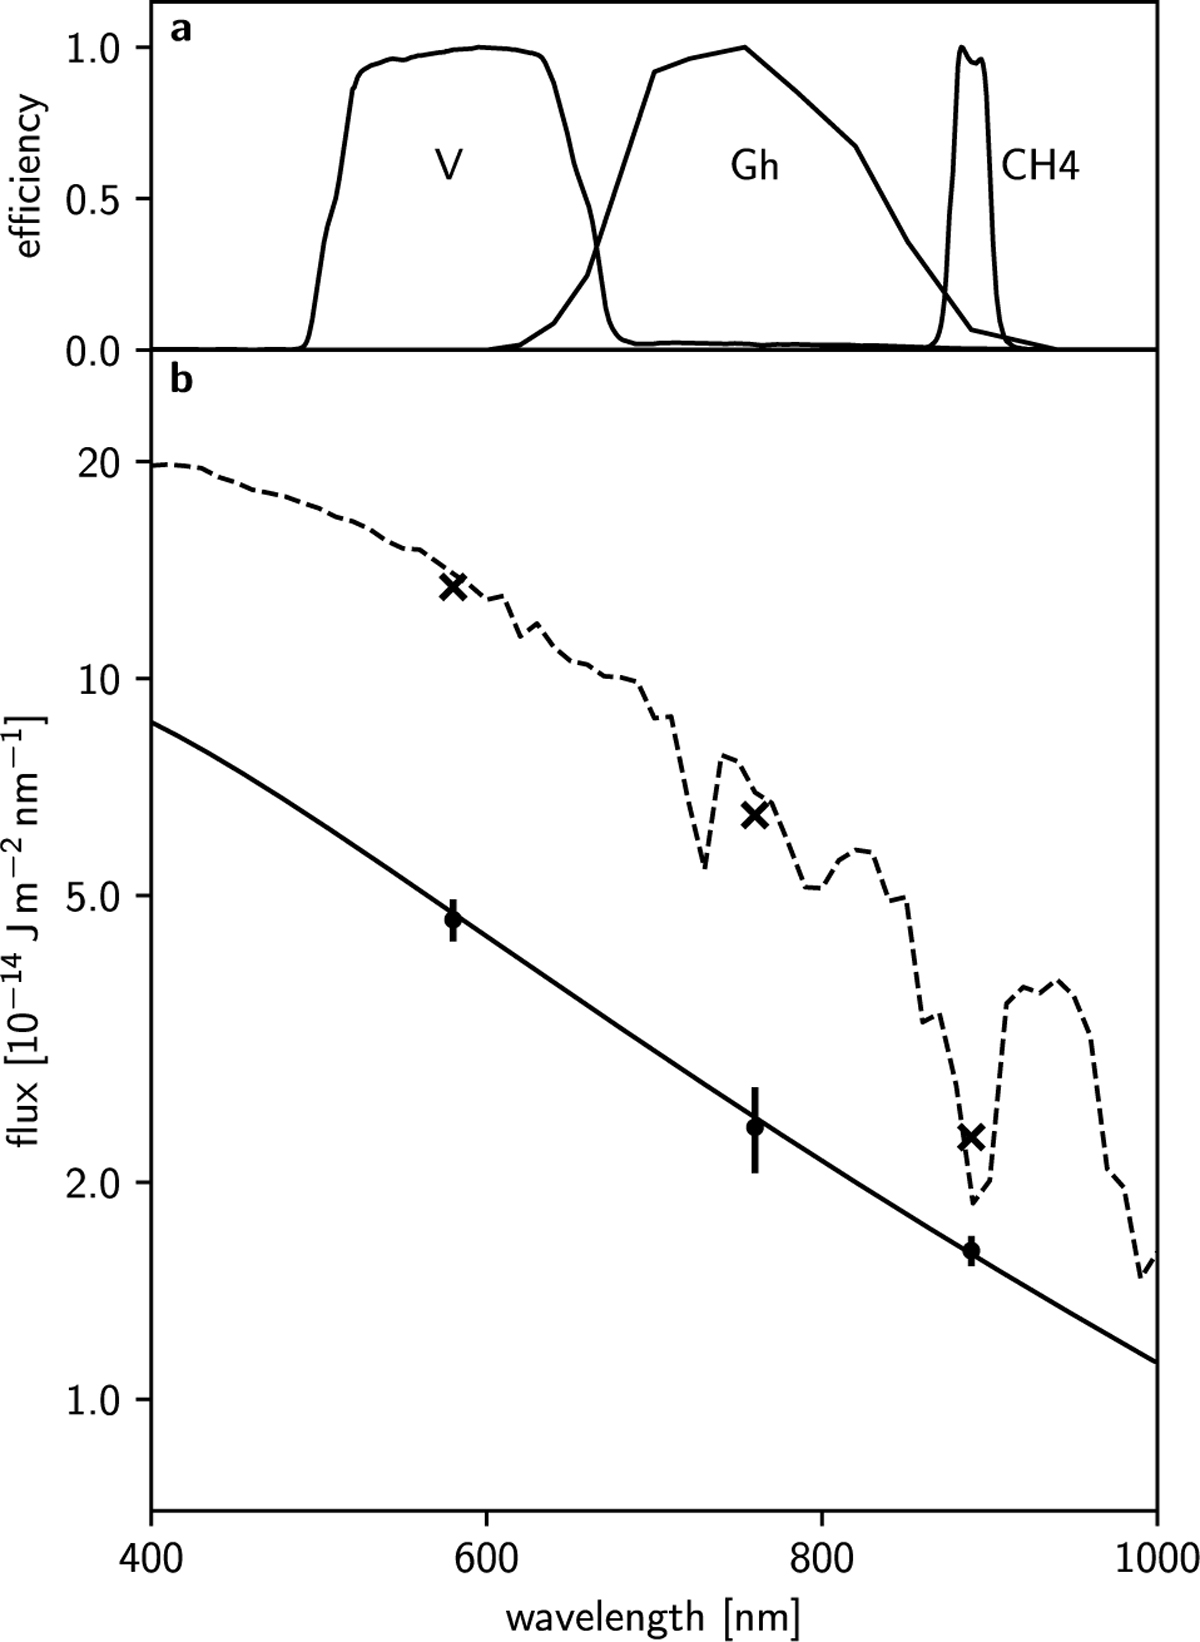
Download original image
Example of the cloud reflection correction results of the 2021 October impact flash (PONCOTS flash) data. (a) Relative spectral responses of the three PONCOTS bands, V, Gh, and CH4. (b) A SED obtained during the peak phase of the flash, overlaid with its cloud correction results and the best-fit model spectrum. Crosses and points with error bars represent observed fluxes and those after cloud-reflection correction, respectively. The best-fit spectrum of single-temperature blackbody radiation with a best-fit temperature of 8300 K is shown as the solid line. The dashed line corresponds to the expected total observed flash spectrum, including the cloud reflection contribution.
Current usage metrics show cumulative count of Article Views (full-text article views including HTML views, PDF and ePub downloads, according to the available data) and Abstracts Views on Vision4Press platform.
Data correspond to usage on the plateform after 2015. The current usage metrics is available 48-96 hours after online publication and is updated daily on week days.
Initial download of the metrics may take a while.