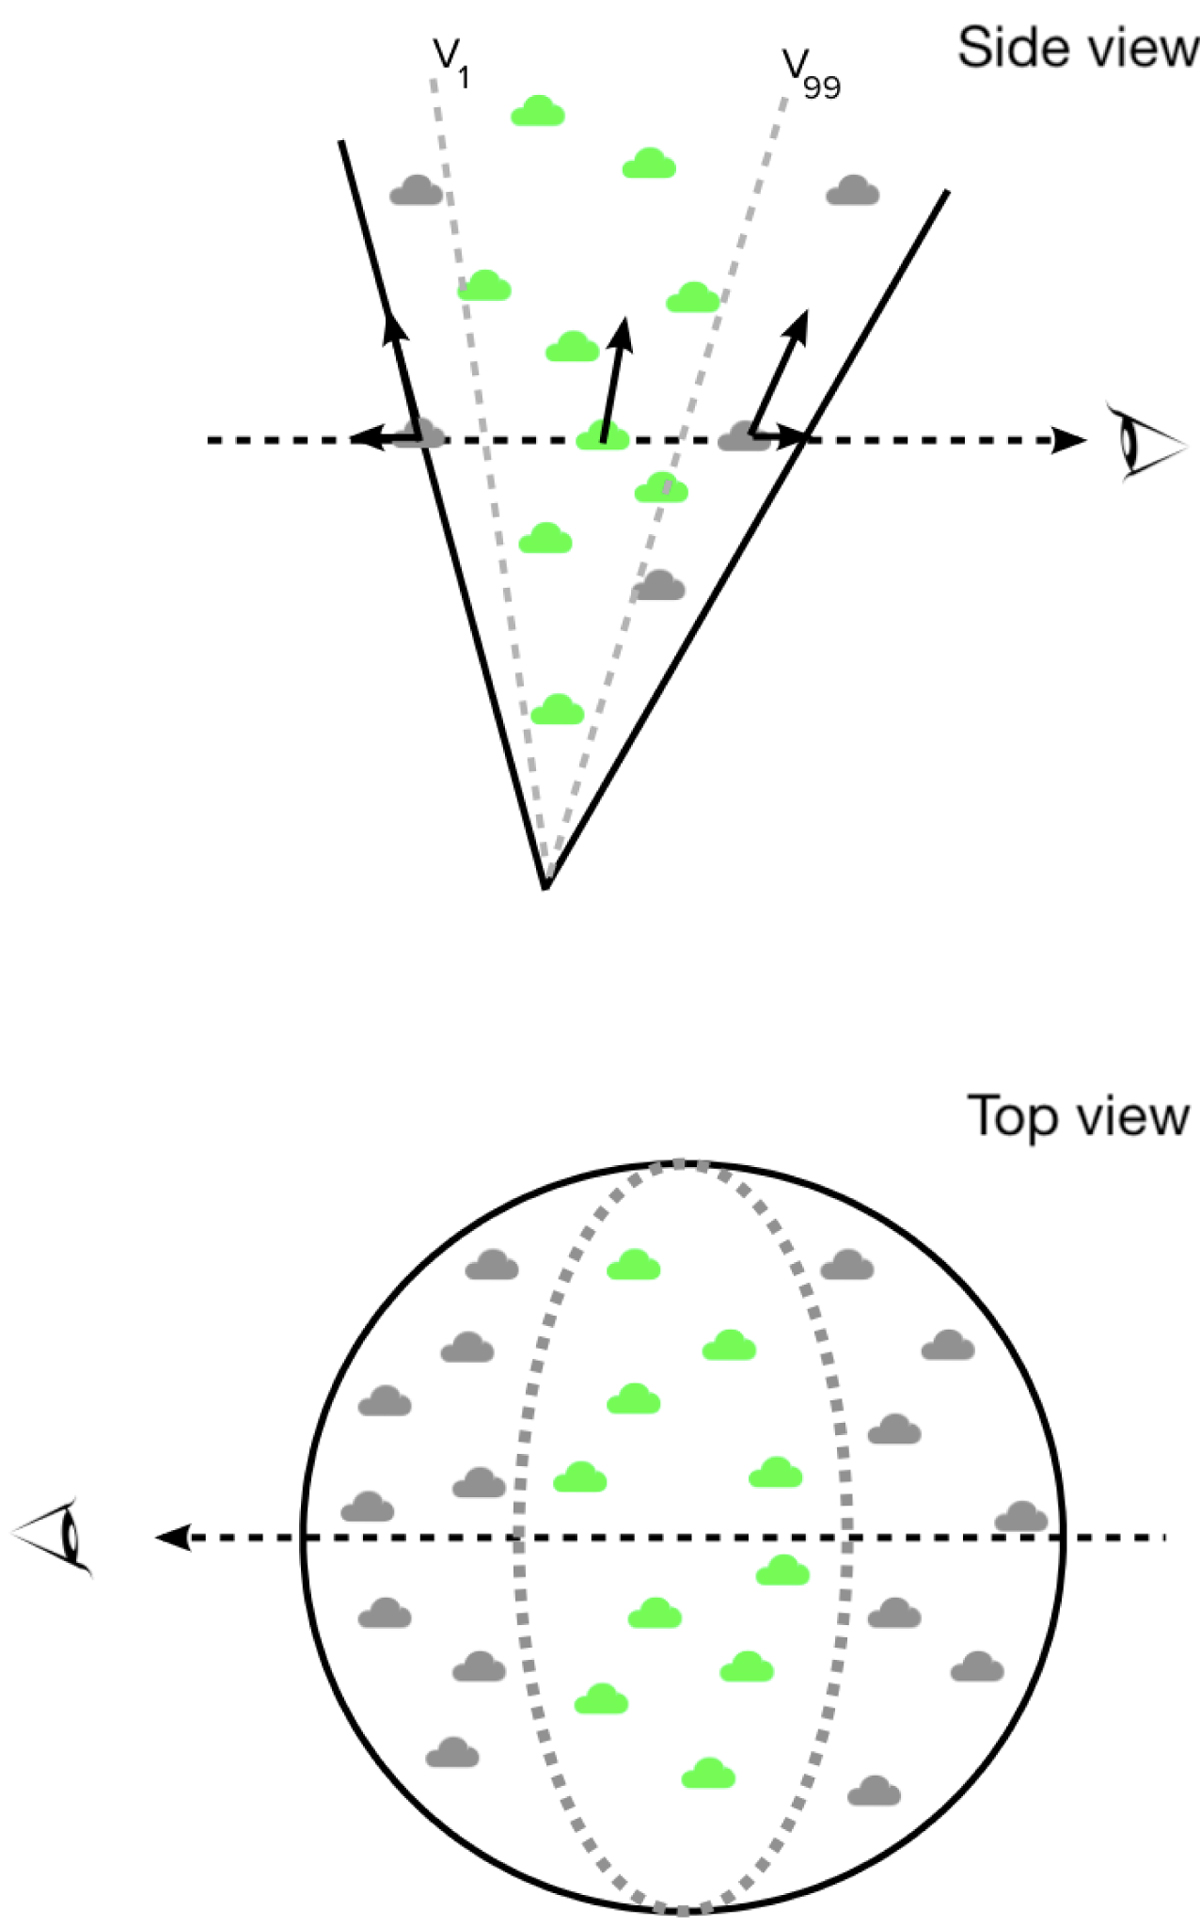
Fig. 7.

Download original image
Schematic explanation of the effect of an excessive radial outflow velocity with fixed model aperture and inclination. The solid black lines define the outflowing cone aperture, the dotted black lines show the LOS directed towards the observer, and the grey dotted lines show the region containing the clouds with projected velocity within the v1, v99 observed boundaries. The grey clouds have LOS velocity above v1, v99, i.e. their weights are zero. Black arrows show the decomposition of the outflow velocity. The top panel shows the view from the top of the model, while the bottom panel shows the flattening effect as seen from the plane of the sky.
Current usage metrics show cumulative count of Article Views (full-text article views including HTML views, PDF and ePub downloads, according to the available data) and Abstracts Views on Vision4Press platform.
Data correspond to usage on the plateform after 2015. The current usage metrics is available 48-96 hours after online publication and is updated daily on week days.
Initial download of the metrics may take a while.


