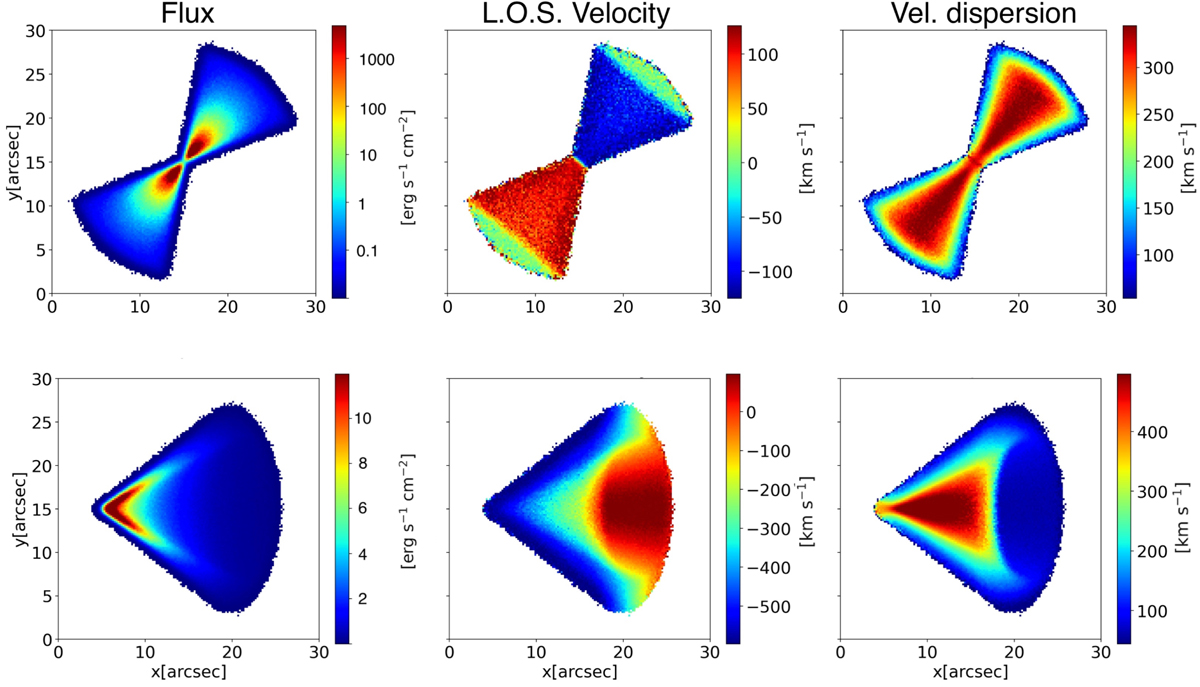
Fig. 4.
Download original image
Example of unweighted models simulating an outflow with the spatial and spectral resolution of a galaxy observed with MUSE at z = 0.001. From left to right: Line-velocity integrated map, LOS velocity map, and velocity dispersion map. Top panels: full biconical model with P.A. = 40°, inclination with respect to the plane of the sky of β = 85°, a constant radial velocity of 1200 km s−1, and a cone semi-aperture of θOUT = 30°. Bottom panels: single hollow conical model with P.A. = 90°, β = 65°, and inner and outer semi-aperture θIN = 25° ,θOUT = 35°. Both models have been convolved with a spatial PSF = 0.3″ and no spectral convolution.
Current usage metrics show cumulative count of Article Views (full-text article views including HTML views, PDF and ePub downloads, according to the available data) and Abstracts Views on Vision4Press platform.
Data correspond to usage on the plateform after 2015. The current usage metrics is available 48-96 hours after online publication and is updated daily on week days.
Initial download of the metrics may take a while.