Fig. 14.
Download original image
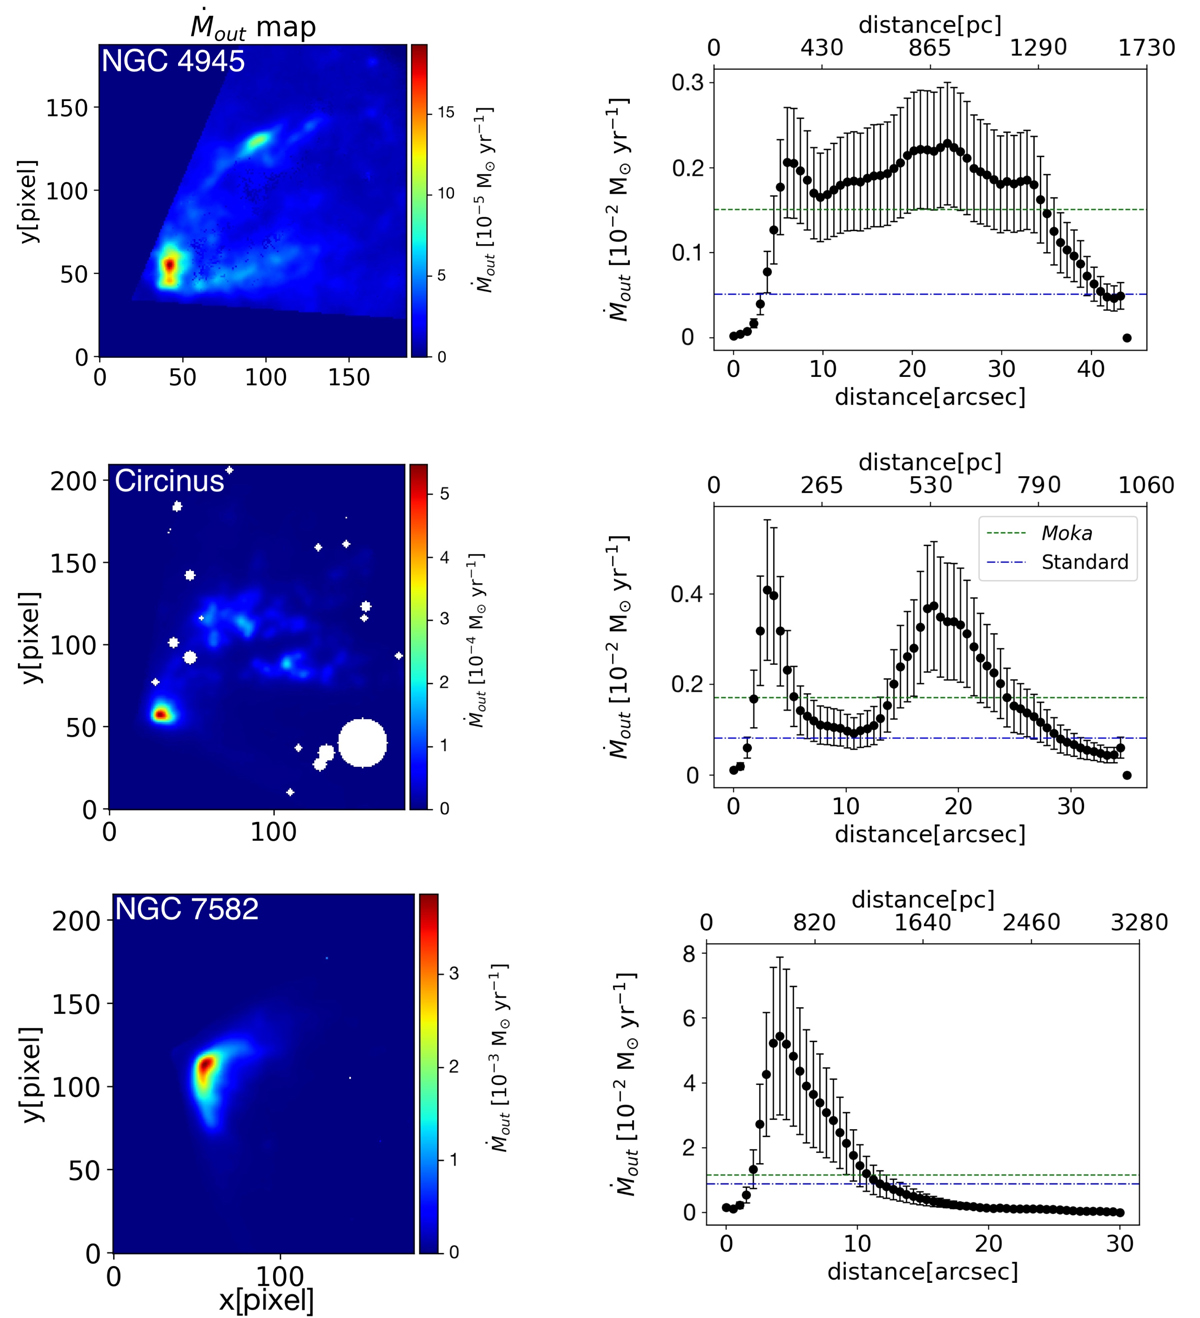
Mass outflow rate distribution of the ionised gas derived from [NII]λ6584 for NGC 4945 and from [OIII]λ5007 for Circinus and NGC 7582. Left panels: 2D maps of the mass-outflow rate distribution. Right panels: radial profile of the mass-outflow rate from the cone vertex. The volume average mass-outflow rate obtained with the MOKA3D-based method (dashed green line) is compared to the standard method result (dotted blue line). The standard method estimate of the volume-average Ṁout is underestimated by a factor of two in NGC 4945 and Circinus. From top to bottom: NGC 4945, Circinus, and NGC 7582.
Current usage metrics show cumulative count of Article Views (full-text article views including HTML views, PDF and ePub downloads, according to the available data) and Abstracts Views on Vision4Press platform.
Data correspond to usage on the plateform after 2015. The current usage metrics is available 48-96 hours after online publication and is updated daily on week days.
Initial download of the metrics may take a while.