Fig. 11.
Download original image
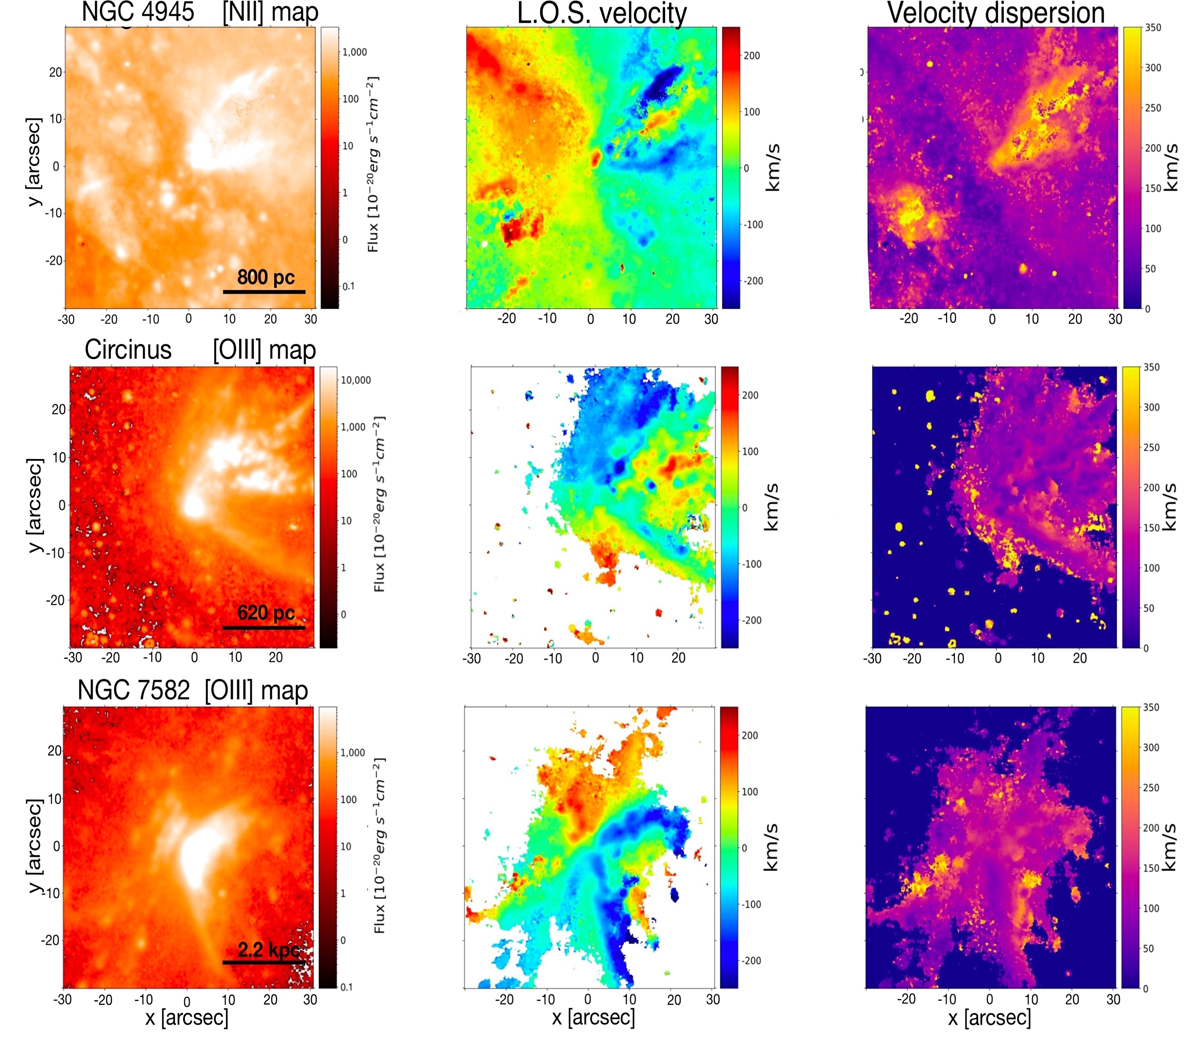
Moment maps of the sample. From top to bottom: NGC 4945, Circinus, and NGC 7582. From left to right: Integrated surface brightness map in units of 10−20 erg cm−2 s−1 arcsec−2, intensity-weighted velocity and velocity dispersion. The first row shows the [NII]λ6584 emission in NGC 4945 and the last two rows refers to the [OIII]λ5007 emission. North is up. The maps are 1 spaxel−σ spatially re-smoothed, so as to get a better visual output, and pixels with S/N ≥ 3 are masked. The maps are obtained from the spectroscopic analysis of the modelled emission line from MUSE data (e.g., Marasco et al. 2020).
Current usage metrics show cumulative count of Article Views (full-text article views including HTML views, PDF and ePub downloads, according to the available data) and Abstracts Views on Vision4Press platform.
Data correspond to usage on the plateform after 2015. The current usage metrics is available 48-96 hours after online publication and is updated daily on week days.
Initial download of the metrics may take a while.