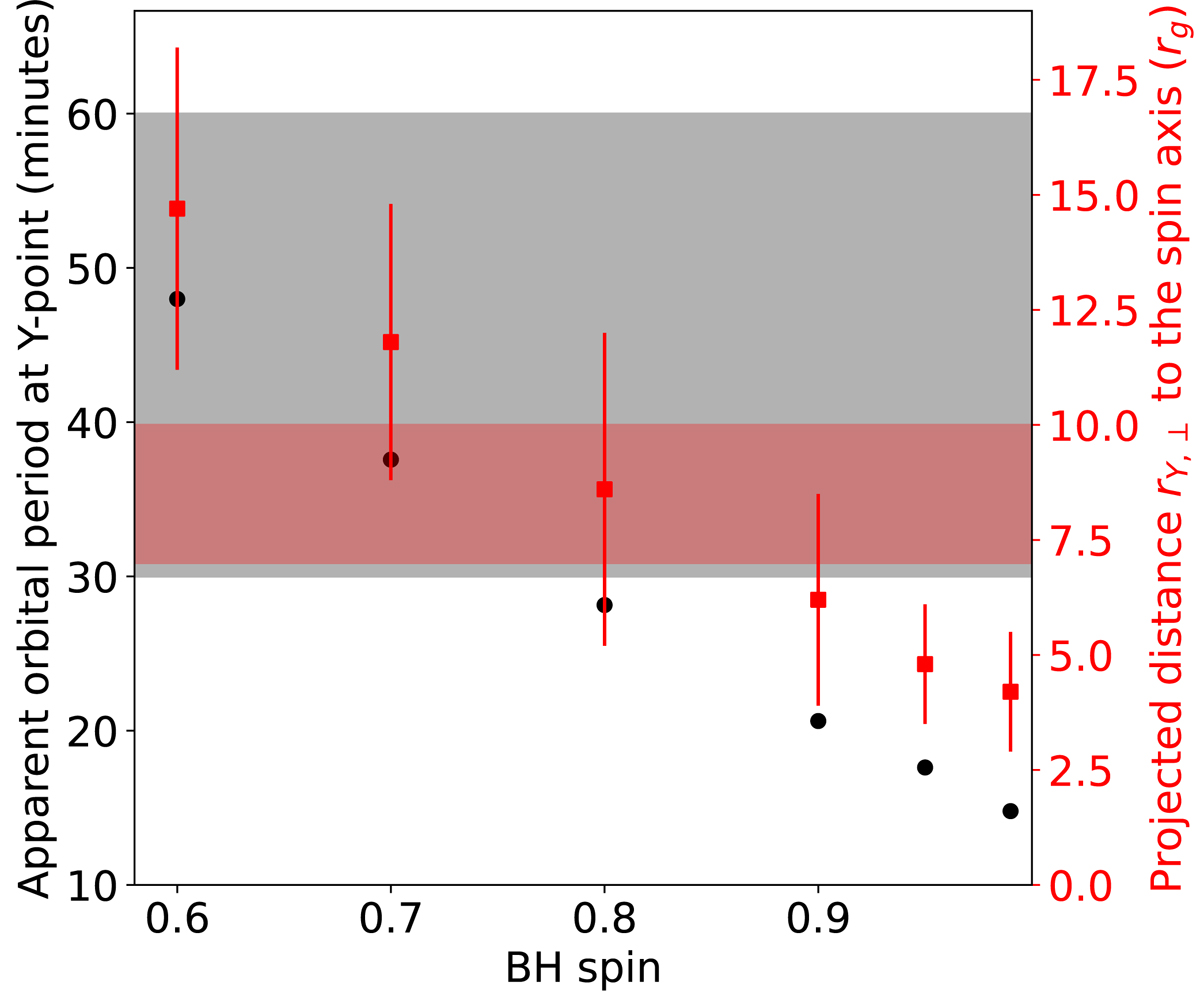
Fig. 9.

Download original image
Apparent orbital period at the Y-ring (left axis, black dots) and projected distance of the Y-ring to the spin axis (right axis, red squares) as a function of the BH spin. The points for BH spin a < 0.99 are extrapolated from the 2.5D simulations of Paper I but include the correction factor on the plasma velocity at the Y-ring we measure in 3D simulations. The hatched regions in black and red stand for the constraints set by the GRAVITY observations and modeling of the 2018 hot spots (GRAVITY Collaboration 2020).
Current usage metrics show cumulative count of Article Views (full-text article views including HTML views, PDF and ePub downloads, according to the available data) and Abstracts Views on Vision4Press platform.
Data correspond to usage on the plateform after 2015. The current usage metrics is available 48-96 hours after online publication and is updated daily on week days.
Initial download of the metrics may take a while.


