Fig. 5.

Download original image
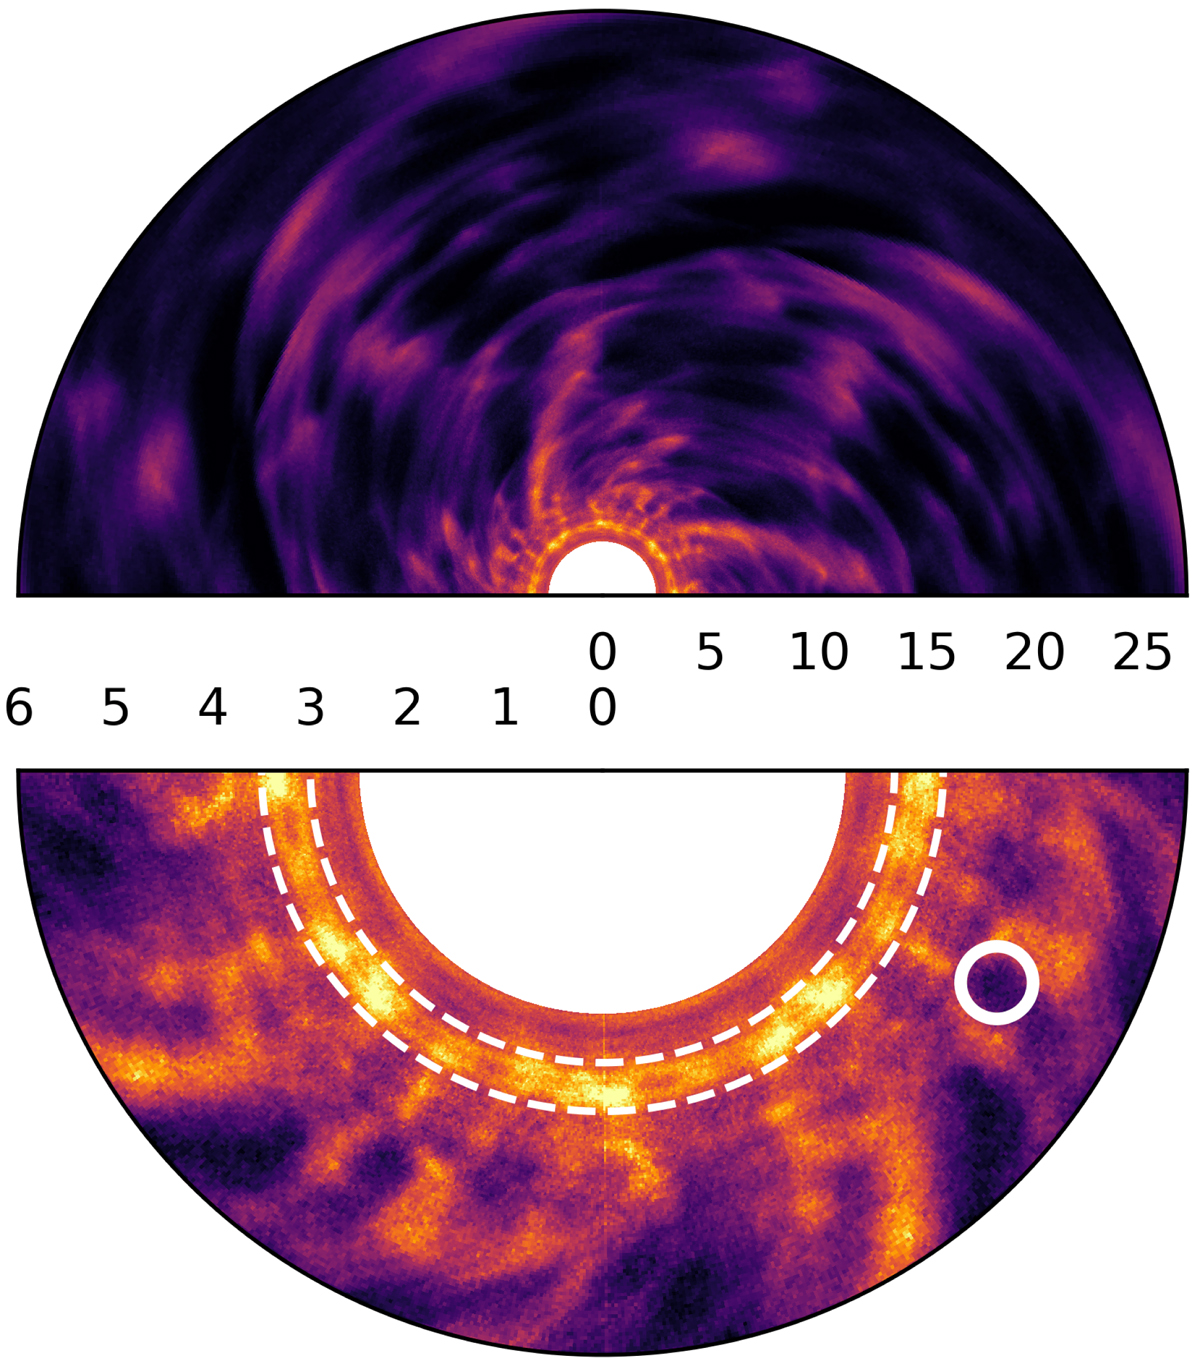
Top view projection of the flux ropes in the full and inner current layer (resp. top and bottom panels), with the same color map as in Fig. 2. Numbers indicate the length in rg along the current layer, with the outer edge of the inner white disk located at the current layer footpoint on the disk rft ∼ 2.5rg. In the bottom panel, the white dashed lines locate the Y-ring. The white circle surrounds an X-point and delimits the region where we compute the transverse velocity profiles in Fig. 6.
Current usage metrics show cumulative count of Article Views (full-text article views including HTML views, PDF and ePub downloads, according to the available data) and Abstracts Views on Vision4Press platform.
Data correspond to usage on the plateform after 2015. The current usage metrics is available 48-96 hours after online publication and is updated daily on week days.
Initial download of the metrics may take a while.


