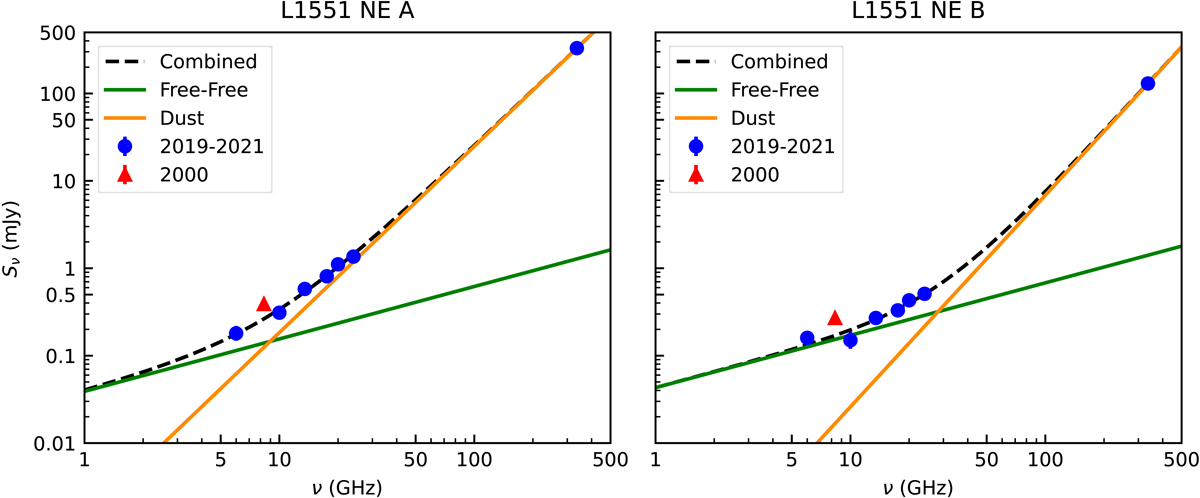
Fig. 6.
Download original image
Spectra of component A (left) and component B (right) of L1551 NE including the total flux density values from this work obtained in 2019–2021 (blue circles) and the values from Reipurth et al. (2002) obtained in 2000 (red triangle). The spectra of the 2019–2021 data in both panels were fitted with a combination of free-free emission from the jet (green line) and dust emission from the disk (orange line). The combined fits are shown by the dotted black lines.
Current usage metrics show cumulative count of Article Views (full-text article views including HTML views, PDF and ePub downloads, according to the available data) and Abstracts Views on Vision4Press platform.
Data correspond to usage on the plateform after 2015. The current usage metrics is available 48-96 hours after online publication and is updated daily on week days.
Initial download of the metrics may take a while.