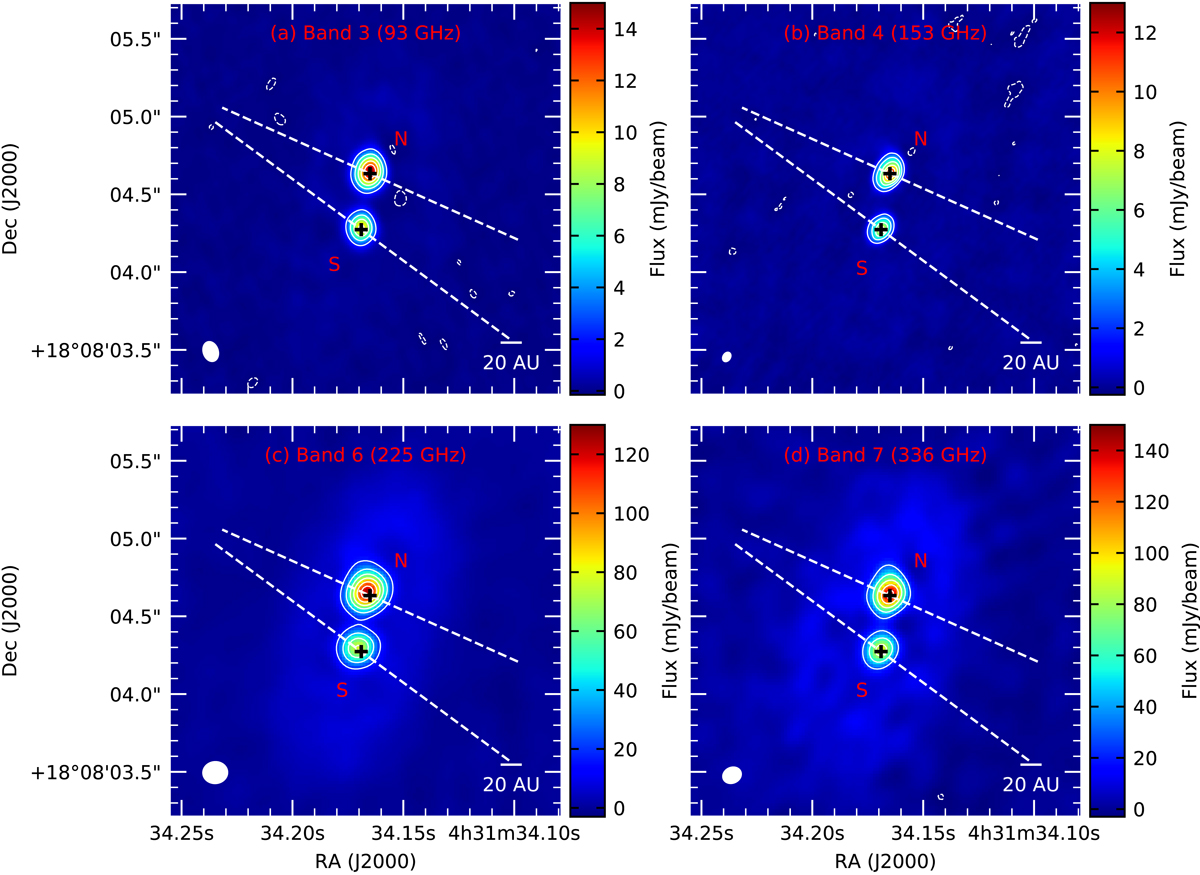
Fig. 2.
Download original image
L1551 IRS 5 from the ALMA observations (contours + colour scale) as follows: (a) the ALMA 93 GHz image (b) the ALMA 153 GHz image (c) the ALMA 225 GHz image (d) the ALMA 336 GHz image. The black crosses in each image indicate the peaks of the disk emission of the two sources in the ALMA 153 GHz image to show the approximate positions of the central stars. The jet axes of the two components from Rodríguez et al. (2003b) are shown by the dotted white lines. The contour levels in the 93 GHz image are −3, 50, 100, 150, 200, 250, and 300 × σrms, where σrms is the root-mean-square noise of the image. For the 153 GHz and 225 GHz images, the contour levels are −3, 25, 50, 75, 100, 125, and 150 × σrms. For the 336 GHz image, the contour levels are −3, 25, 50, 75, 100, and 125 × σrms. The synthesised beam for each image is shown in the bottom left corner. The values for the synthesised beam and σrms of each image are given in Table 3.
Current usage metrics show cumulative count of Article Views (full-text article views including HTML views, PDF and ePub downloads, according to the available data) and Abstracts Views on Vision4Press platform.
Data correspond to usage on the plateform after 2015. The current usage metrics is available 48-96 hours after online publication and is updated daily on week days.
Initial download of the metrics may take a while.