Fig. B.1.
Download original image
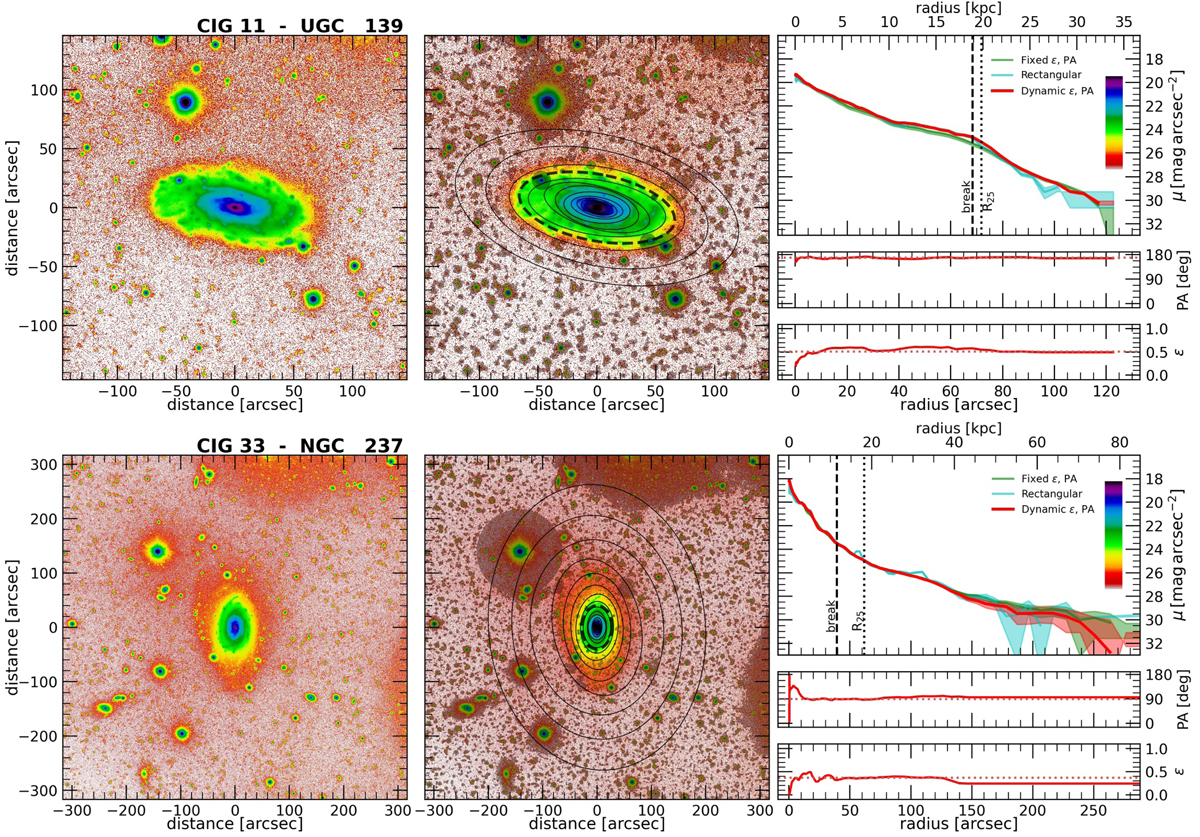
Surface brightness images and profiles for all the galaxies in our sample. Left panel: r-band or luminance images for the galaxy. The ID of each galaxy is shown above. The scale of the colours represents the surface brightness of the image, and the scale is shown in the profile panel (right) following the y-axis scale. Middle panel: Same image with the mask applied and the elliptical apertures of the dynamic positional angle and ellipticity profile. Right panel: Surface brightness profile (top), positional angle (middle), and ellipticity (bottom) as a function of the radius in arcseconds (bottom) and kiloparsec (top). The red and green line show the dynamic and fixed elliptical apertures, respectively. The blue line represents the profiles obtained from rectangular apertures. The position of the disc break (if any) is shown with the vertical and elliptical aperture of the dashed line. The dotted line in the right panel represents the radius at 25 mag arcsec−2. We smoothed the CIG 613 image using the FABADA algorithm (Sánchez-Alarcón & Ascasibar 2023) to enhance the faint structures, and we indicate with arrows the tidal stream found for this galaxy. More information about the figure can be found in Section 4.
Current usage metrics show cumulative count of Article Views (full-text article views including HTML views, PDF and ePub downloads, according to the available data) and Abstracts Views on Vision4Press platform.
Data correspond to usage on the plateform after 2015. The current usage metrics is available 48-96 hours after online publication and is updated daily on week days.
Initial download of the metrics may take a while.