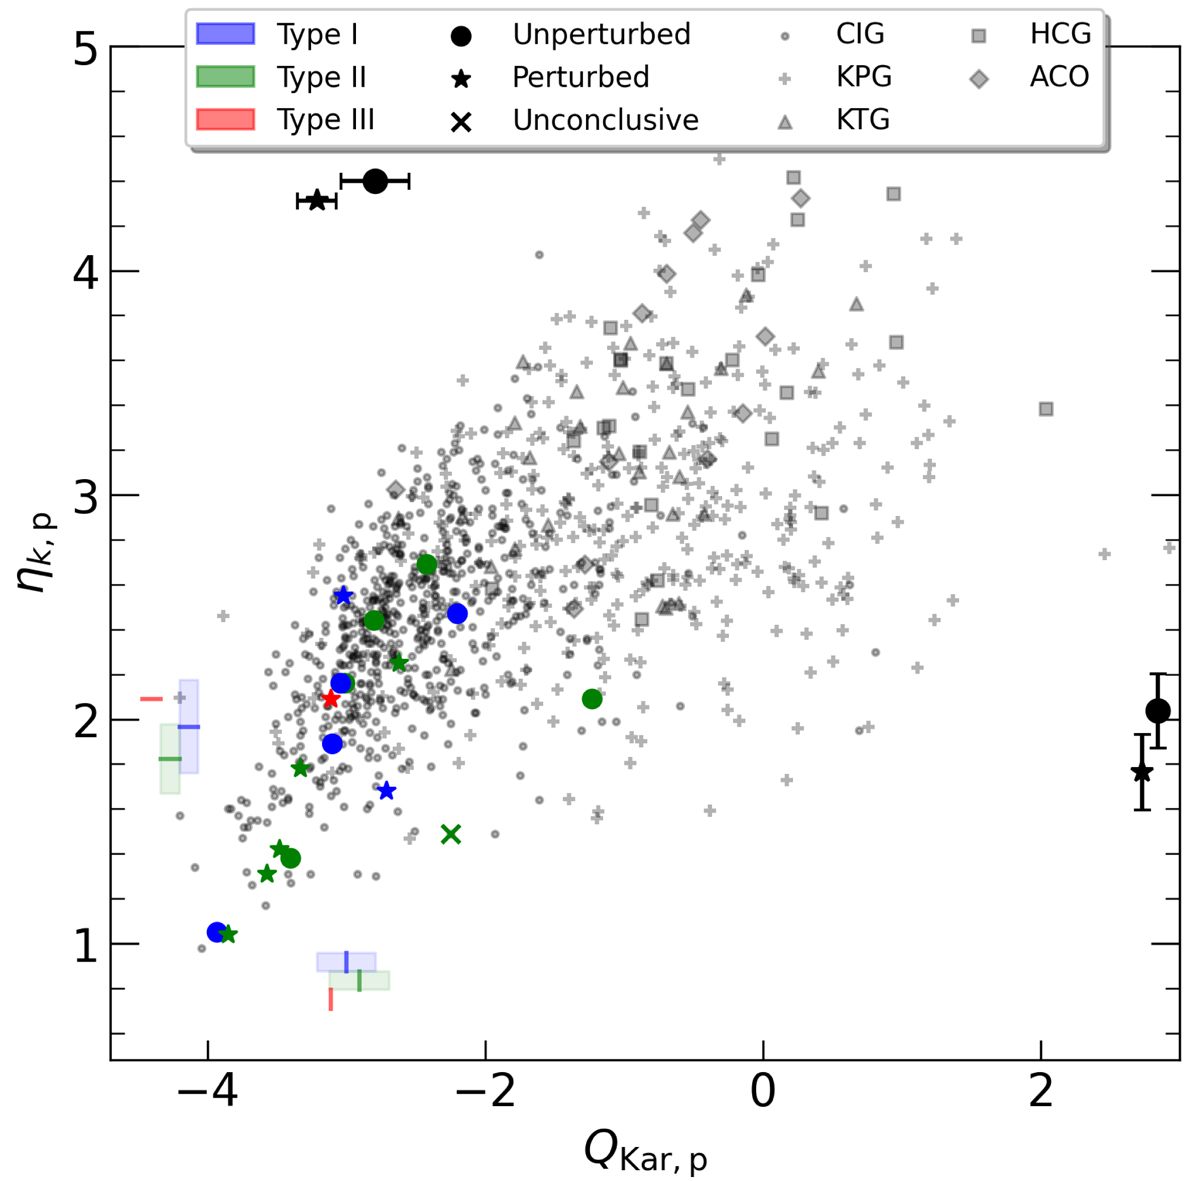
Fig. 6.
Download original image
Photometric isolation parameter for 18 galaxies of our sample, and the local number density of neighbour galaxies, ηk, p, compared to the tidal strength, QKar, p, from Argudo-Fernández et al. (2013). The colour code represents the type of disc: blue, green, and red for Types I, II, and III, respectively. The mean values of each type are represented by the line close to the axis (bottom and left) with its corresponding error. Circles and stars represent unperturbed and perturbed galaxies, respectively. The mean values of perturbed and unperturbed galaxies are represented by the symbols close to the axis (upper and right) with their corresponding error. The crosses correspond to galaxies that were not classified due to galactic cirrus. Background grey values represent galaxies from different samples (see Sect. 4 for details).
Current usage metrics show cumulative count of Article Views (full-text article views including HTML views, PDF and ePub downloads, according to the available data) and Abstracts Views on Vision4Press platform.
Data correspond to usage on the plateform after 2015. The current usage metrics is available 48-96 hours after online publication and is updated daily on week days.
Initial download of the metrics may take a while.