Fig. 3.
Download original image
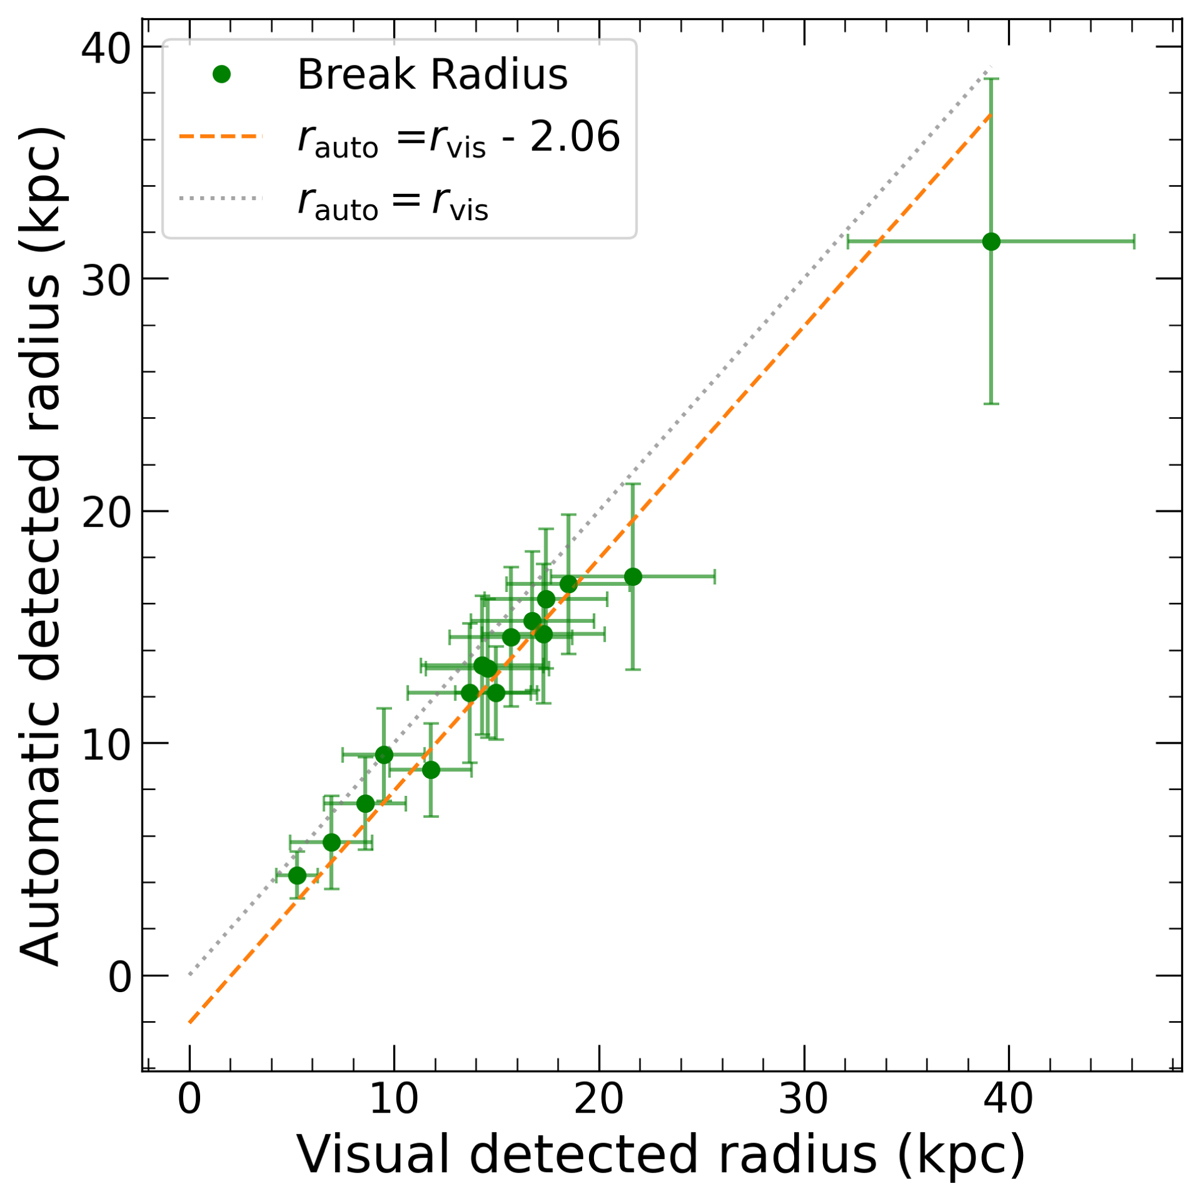
Radii found via an automatic procedure as explained in Watkins et al. (2019) compared to those found via visual inspection of the profiles. The dotted grey line represents the 1:1 line, and the dashed orange line represents a linear fit to the data. The error bars were estimated using the distance to the next radial bins in the surface brightness profile at the distance at which the break was measured.
Current usage metrics show cumulative count of Article Views (full-text article views including HTML views, PDF and ePub downloads, according to the available data) and Abstracts Views on Vision4Press platform.
Data correspond to usage on the plateform after 2015. The current usage metrics is available 48-96 hours after online publication and is updated daily on week days.
Initial download of the metrics may take a while.