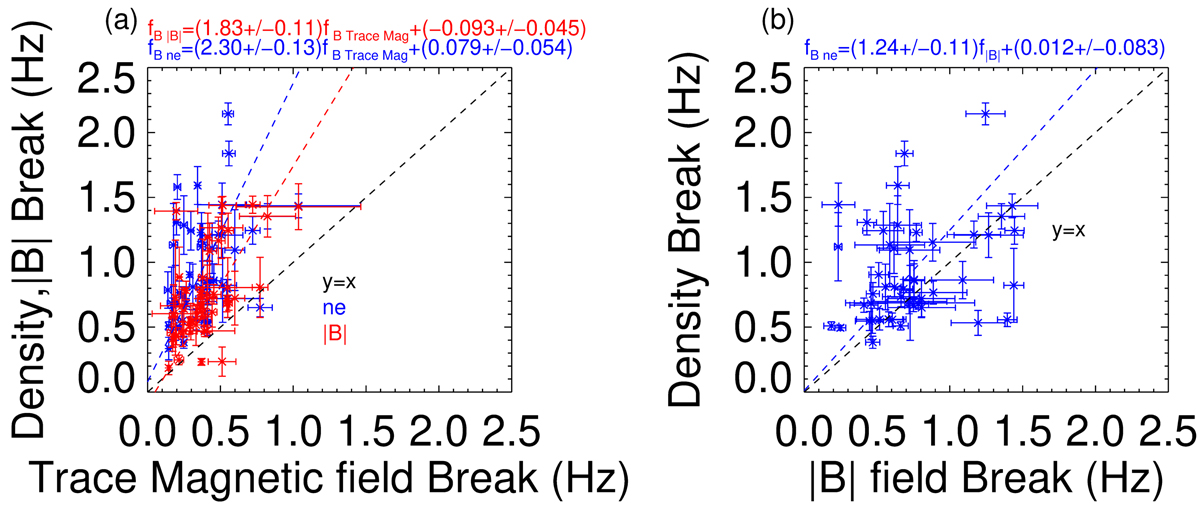
Fig. A.1.
Download original image
Comparison between the spectral break locations for different spectra. a: Comparison between the trace magnetic field and density and magnetic field magnitude spectral break. The blue line denotes the y=x and the red line denotes the fitting to the data points. b: Comparison of the density break and the magnetic field magnitude spectral break.
Current usage metrics show cumulative count of Article Views (full-text article views including HTML views, PDF and ePub downloads, according to the available data) and Abstracts Views on Vision4Press platform.
Data correspond to usage on the plateform after 2015. The current usage metrics is available 48-96 hours after online publication and is updated daily on week days.
Initial download of the metrics may take a while.