Fig. 1.
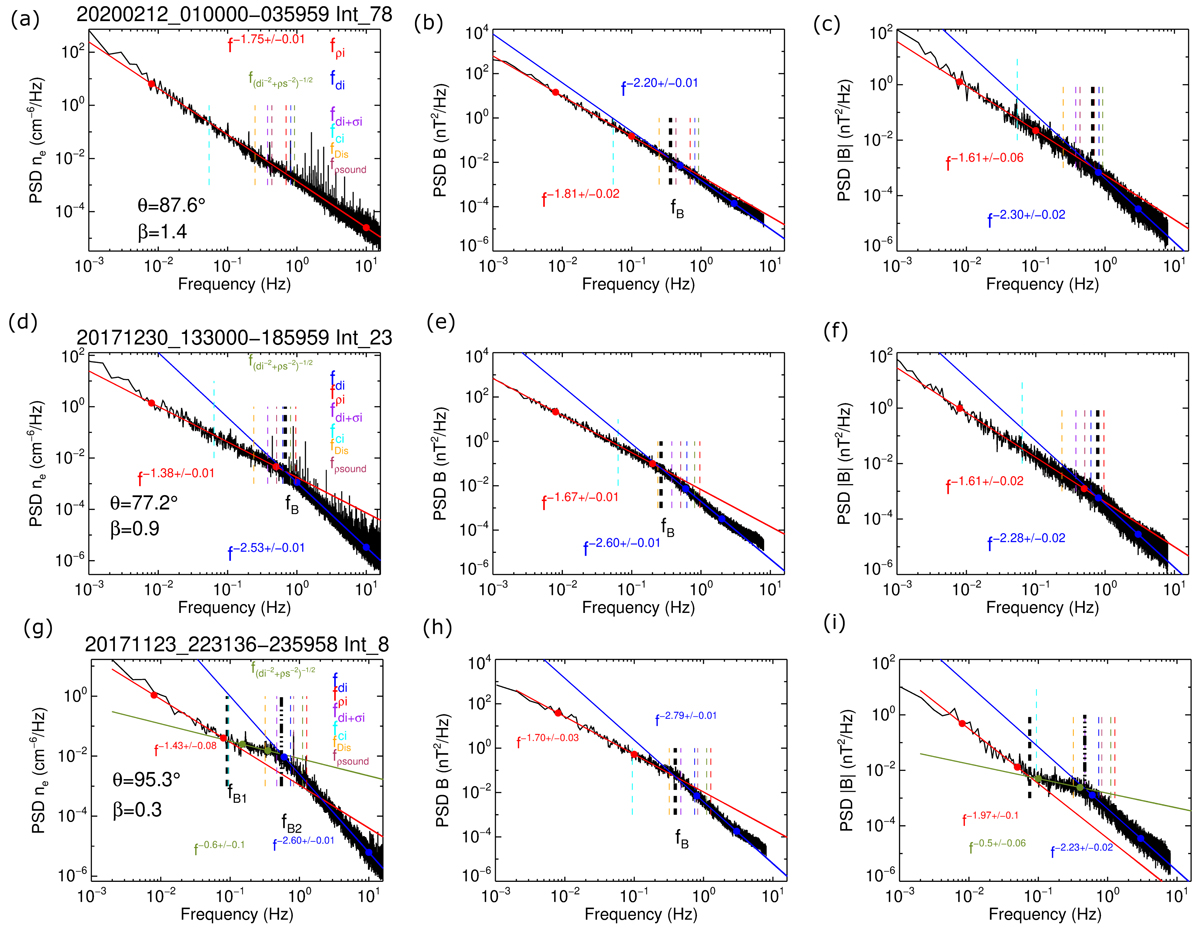
Download original image
Density, trace magnetic field, and magnetic field magnitude spectra of three representative cases from the study. Panels a, d, g show the density spectra, panels b, e, h show the corresponding trace magnetic field spectra, and panels c, f, i show the magnetic field magnitude spectra. The vertical dashed lines indicate several characteristic scales, and the thick black lines denote the obtained spectral breaks. The power law fits are shown as solid lines, and the corresponding dots denote the range. The ion plasma beta and the average angle between the field and the flow, θ, are also indicated.
Current usage metrics show cumulative count of Article Views (full-text article views including HTML views, PDF and ePub downloads, according to the available data) and Abstracts Views on Vision4Press platform.
Data correspond to usage on the plateform after 2015. The current usage metrics is available 48-96 hours after online publication and is updated daily on week days.
Initial download of the metrics may take a while.