Fig. 1.
Download original image
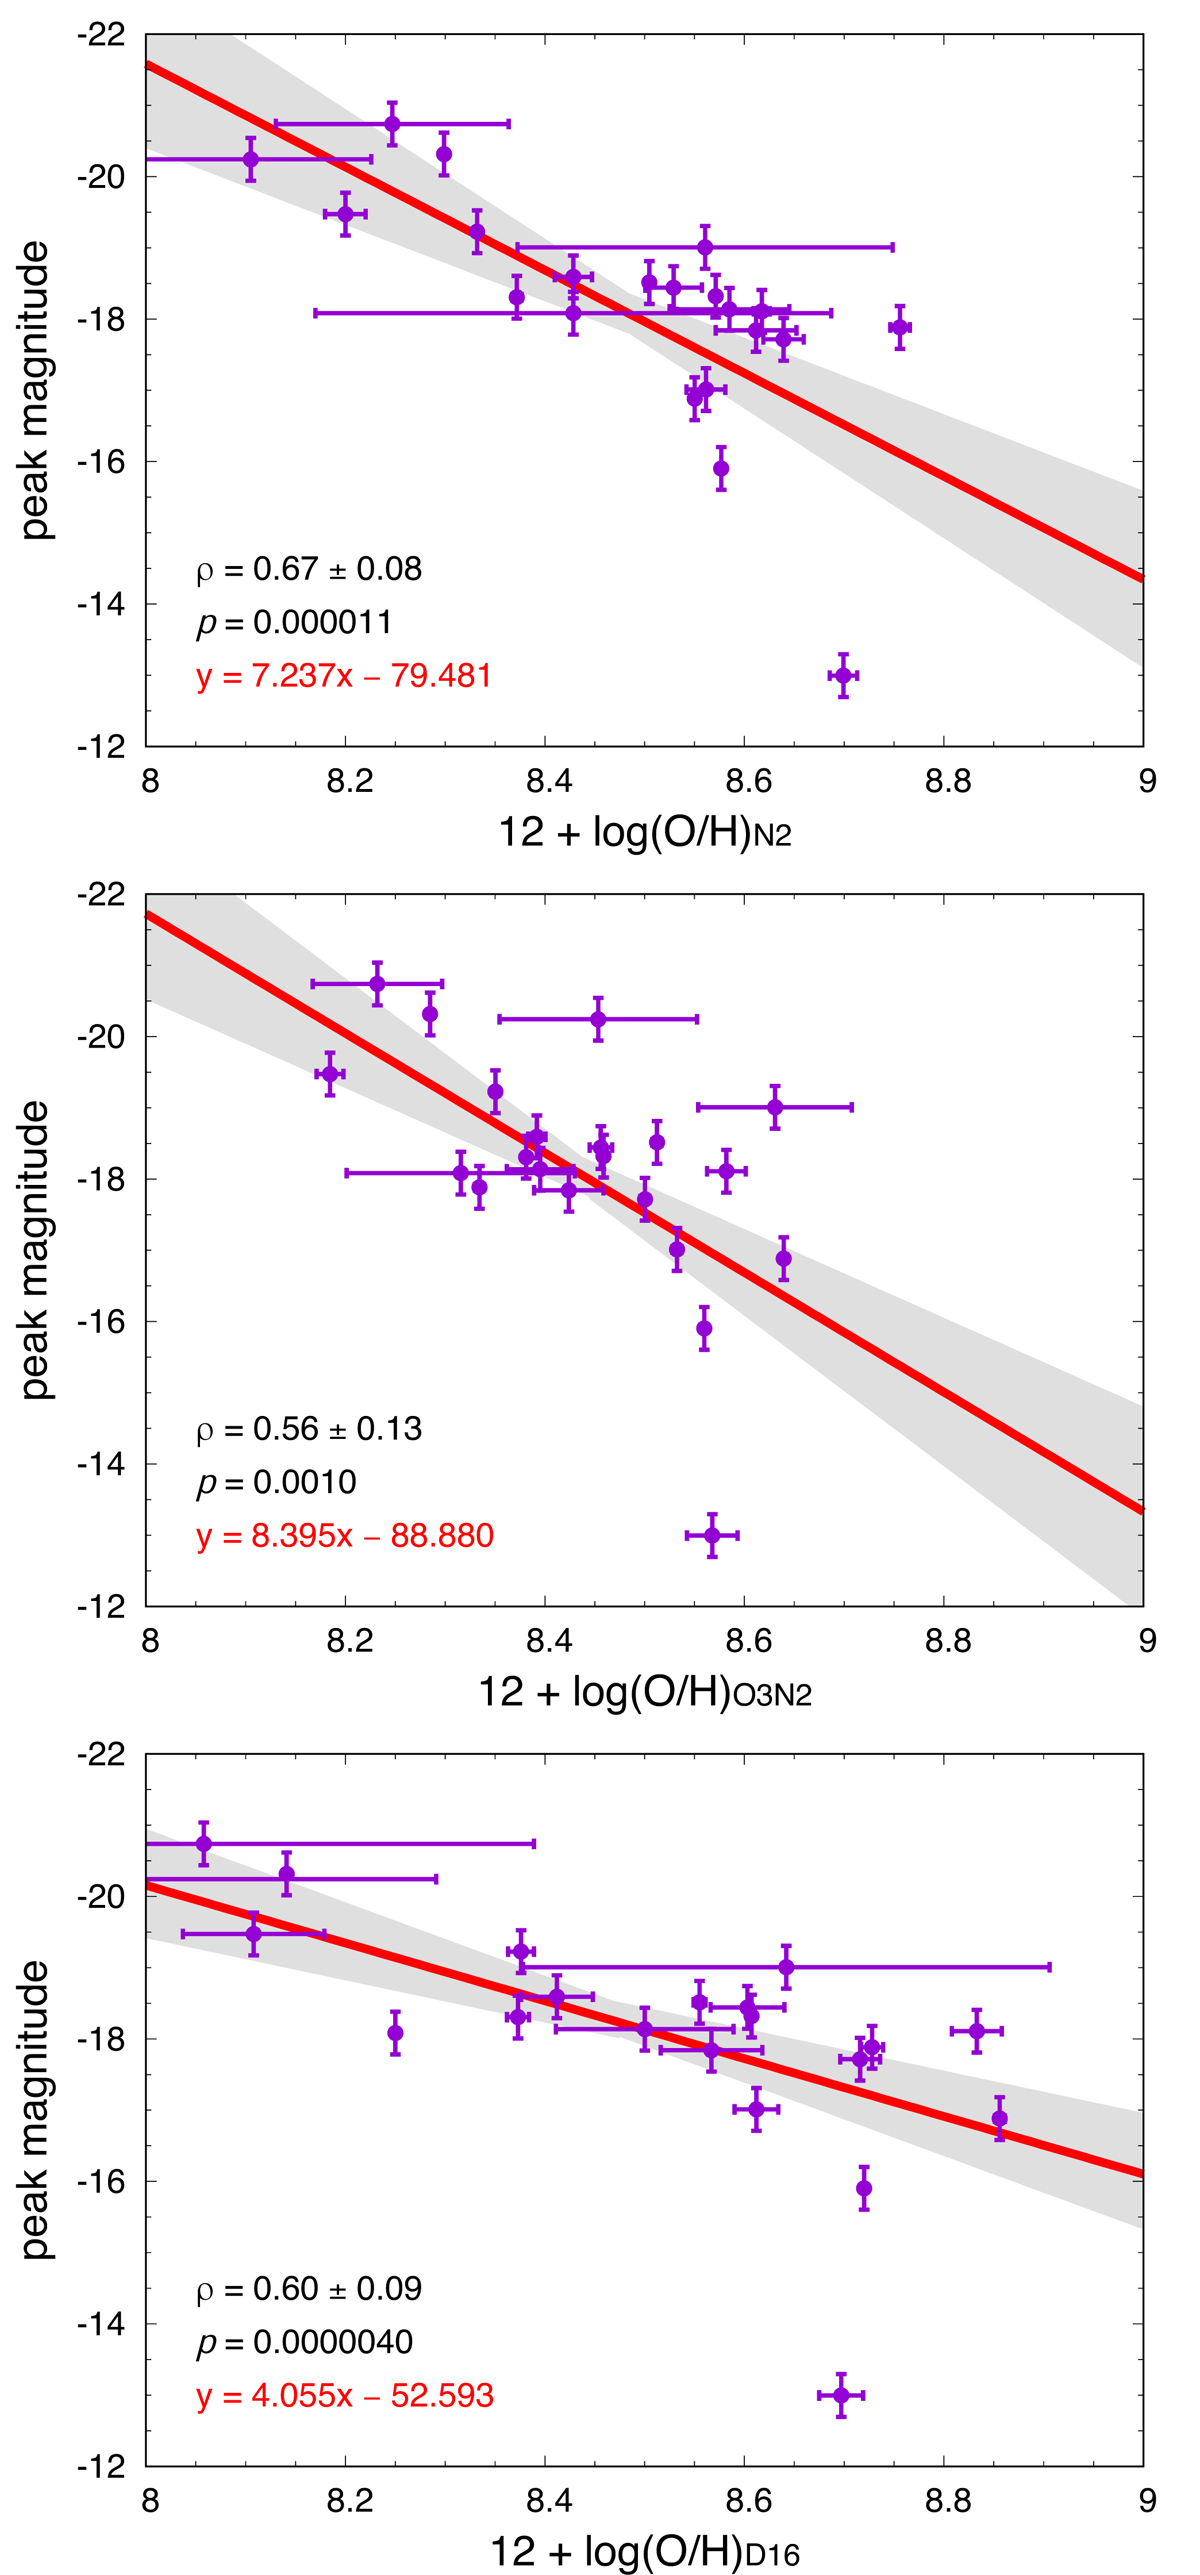
Correlation between metallicity (12 + log(O/H)) and peak magnitude for the three different metallicity estimators (N2 at the top, O3N2 in the middle, and D16 at the bottom). Each Pearson correlation coefficient ρ is shown along with its standard deviation and p value. The best linear fits are shown with the red lines, and the 1σ region is indicated by the gray shades. No host extinction is applied here.
Current usage metrics show cumulative count of Article Views (full-text article views including HTML views, PDF and ePub downloads, according to the available data) and Abstracts Views on Vision4Press platform.
Data correspond to usage on the plateform after 2015. The current usage metrics is available 48-96 hours after online publication and is updated daily on week days.
Initial download of the metrics may take a while.