Fig. 4.
Download original image
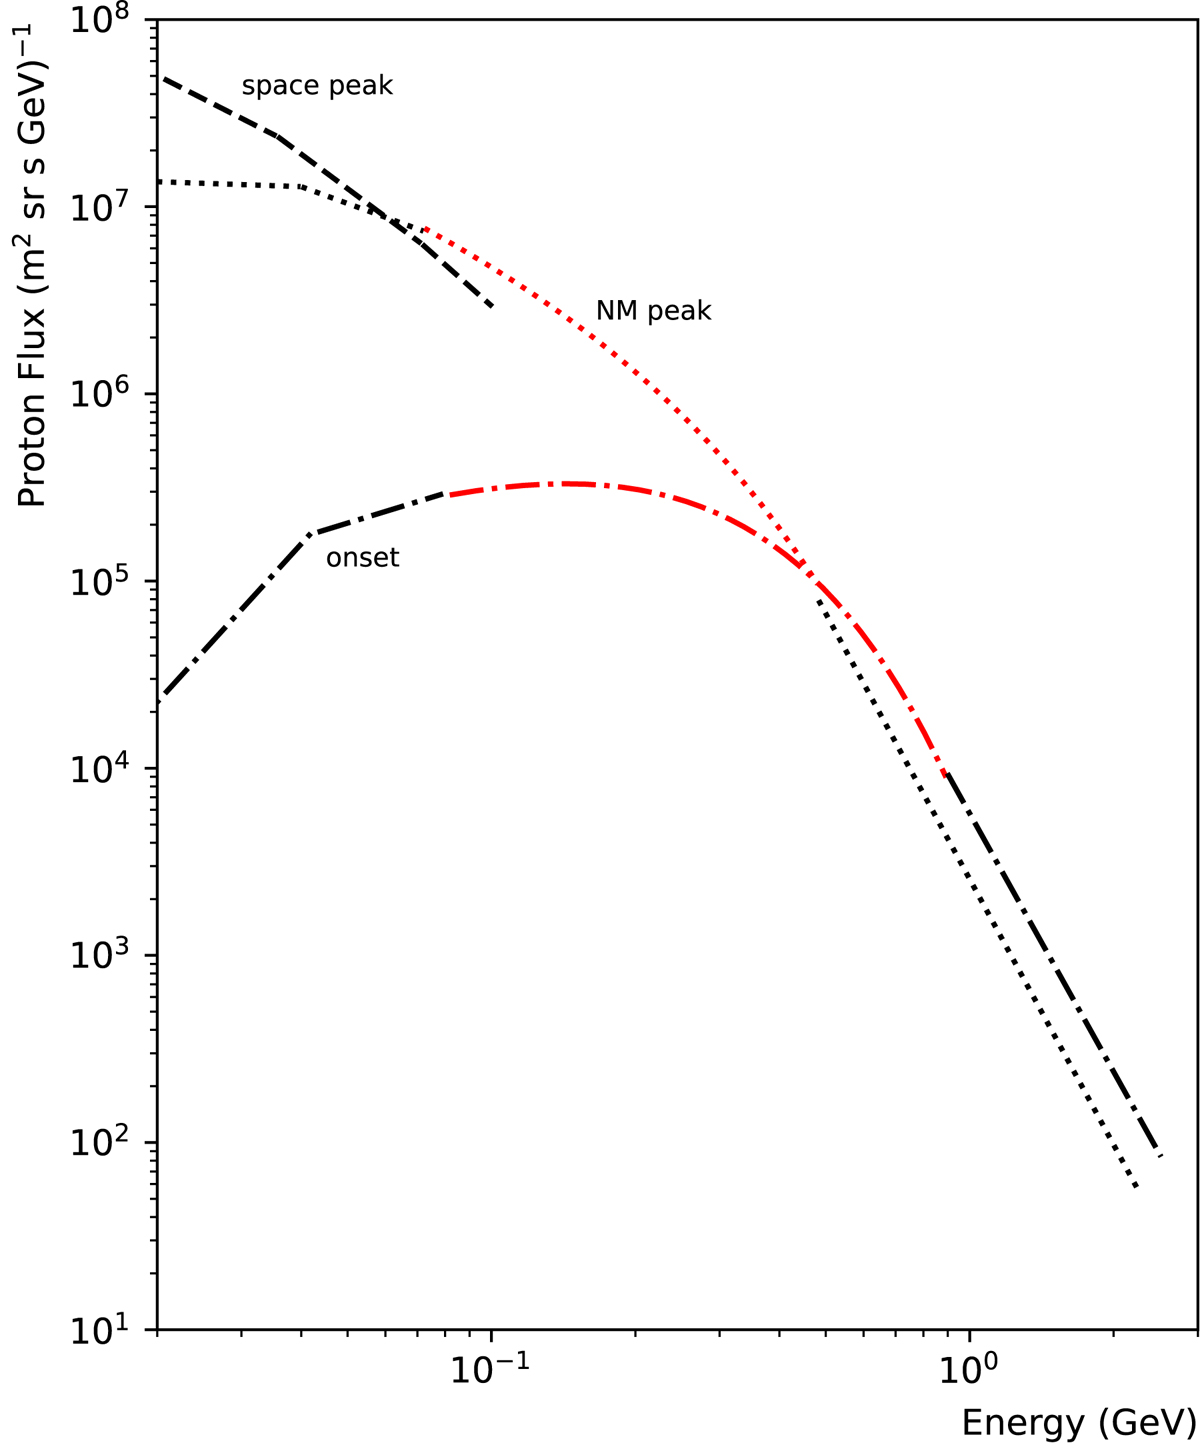
Solar proton energy spectra observed during the evolution of the solar energetic particle event dated October 28, 2021. The dot-dashed line indicates the onset of the event (15:35–16:35 UT). The dotted line corresponds to the peak of the event observed on ground (17:30–18:20 UT) and the dashed line represents the peak of the event in space (20:35–22:35 UT). Low-energy EPD/HET data below 100 MeV and NM observations above 700 MeV have been interpolated between 100 MeV and 700 MeV according to Grimani et al. (2013, red lines).
Current usage metrics show cumulative count of Article Views (full-text article views including HTML views, PDF and ePub downloads, according to the available data) and Abstracts Views on Vision4Press platform.
Data correspond to usage on the plateform after 2015. The current usage metrics is available 48-96 hours after online publication and is updated daily on week days.
Initial download of the metrics may take a while.