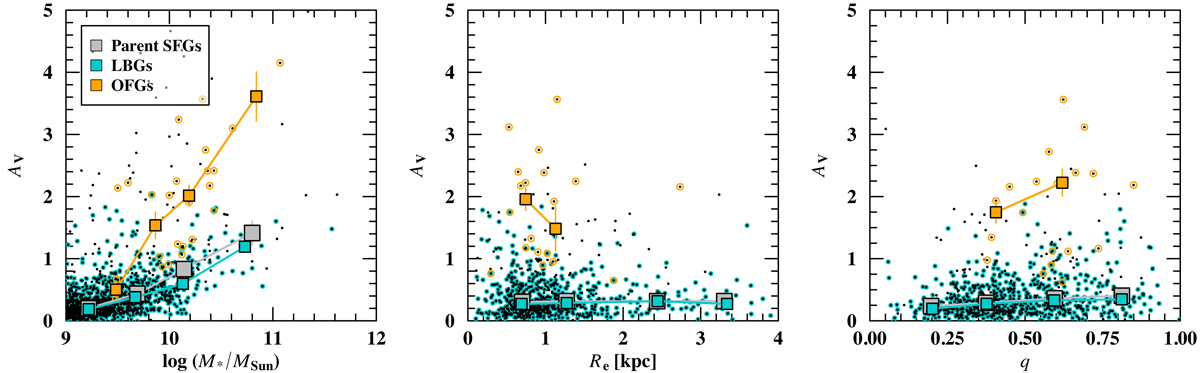
Fig. 7.
Download original image
Dust attenuation as a function of stellar mass (left panel), (circularized) effective radius (middle panel), and axis ratio (right panel). Sliding medians for the different galaxy types shown in the legend are displayed with colored squares, with the error bars representing the uncertainty of the medians. Bins with less than three galaxies are not displayed (see Figs. 4 and 6 for the distributions).
Current usage metrics show cumulative count of Article Views (full-text article views including HTML views, PDF and ePub downloads, according to the available data) and Abstracts Views on Vision4Press platform.
Data correspond to usage on the plateform after 2015. The current usage metrics is available 48-96 hours after online publication and is updated daily on week days.
Initial download of the metrics may take a while.