Fig. 7
Download original image
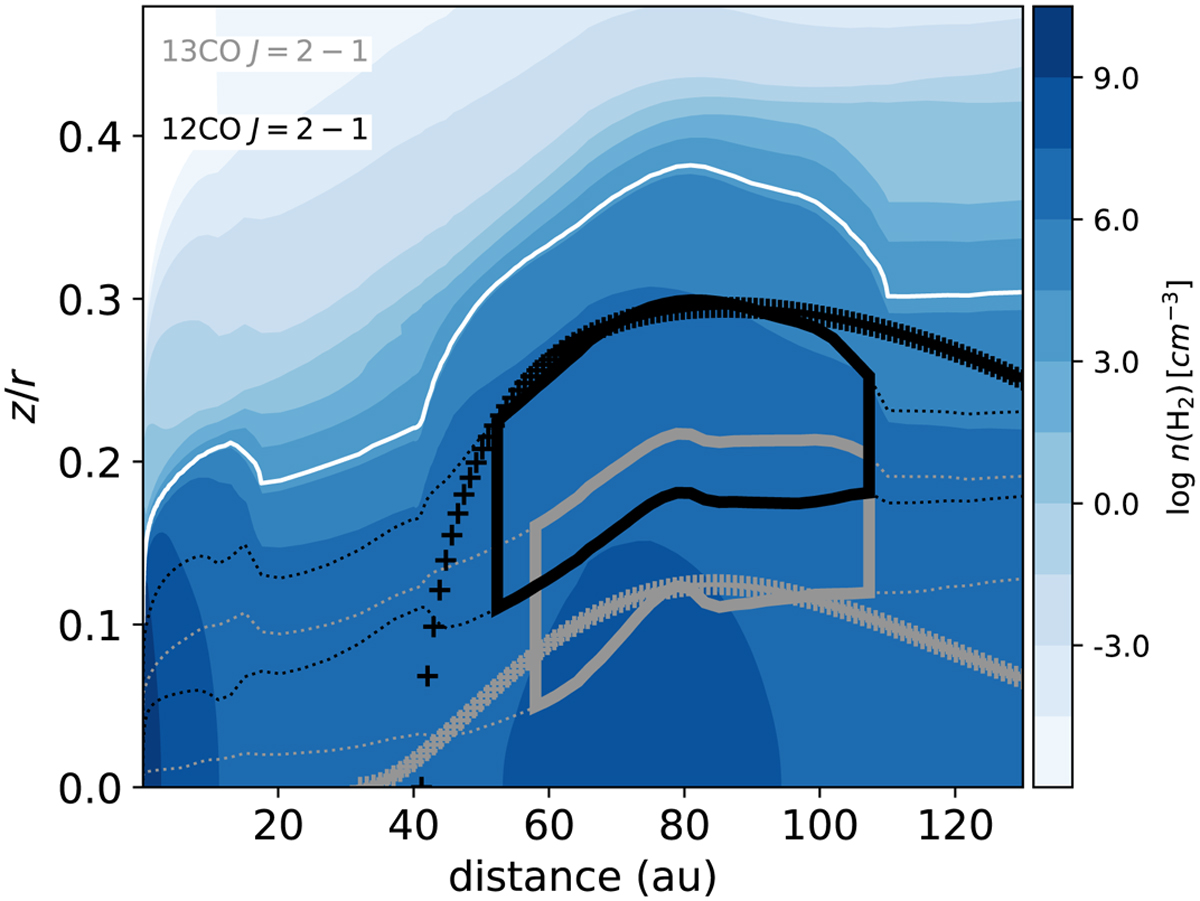
Emitting regions from which 15–85% of the 13CO J = 2–1 (grey solid box) and 12CO J = 2–1 (black solid box) radiation is emitted. Dotted lines indicate the emitting region in the vertical direction only. The grey and black crosses are mapped from the fitting functions to the respective emitting surfaces derived in Law et al. (2023). The white curve is the 1.5 × 104 cm−3 contour for the critical density of the 12CO J = 2–1 transition with H2 as the collision partner. The colour map is the gas density.
Current usage metrics show cumulative count of Article Views (full-text article views including HTML views, PDF and ePub downloads, according to the available data) and Abstracts Views on Vision4Press platform.
Data correspond to usage on the plateform after 2015. The current usage metrics is available 48-96 hours after online publication and is updated daily on week days.
Initial download of the metrics may take a while.