Fig. 6
Download original image
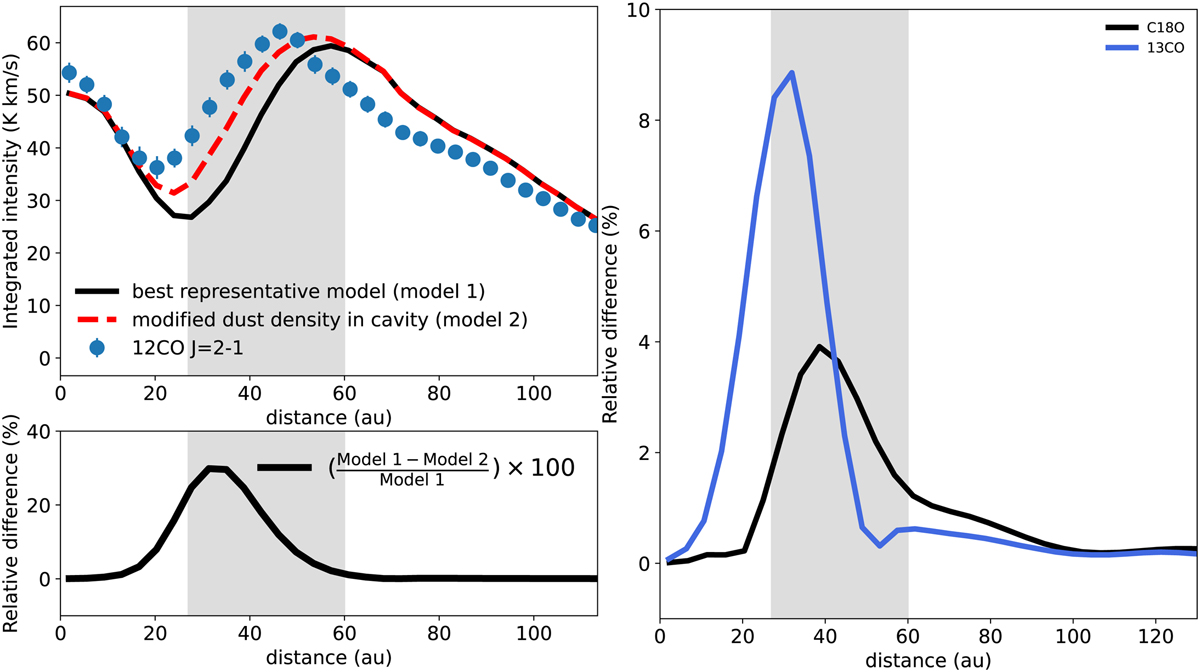
Effect of a localised variation of the dust distribution on line emission. Top left: Azimuthal profiles of the 12CO J=2–1 integrated maps from two models with slightly different dust distributions between 27 au and 60 au. The blue dots are the observations. The shaded area indicates the region where the dust mass was artificially increased by 30% to boost heating by dust thermal accommodation. Bottom left: relative difference of modelled intensities with respect to the best representative model for the 12CO J = 2–1 case. Right: relative difference of integrated intensities for the 13CO J = 2–1 and C18O J = 2–1 cases.
Current usage metrics show cumulative count of Article Views (full-text article views including HTML views, PDF and ePub downloads, according to the available data) and Abstracts Views on Vision4Press platform.
Data correspond to usage on the plateform after 2015. The current usage metrics is available 48-96 hours after online publication and is updated daily on week days.
Initial download of the metrics may take a while.