Open Access
Fig. 4
Download original image
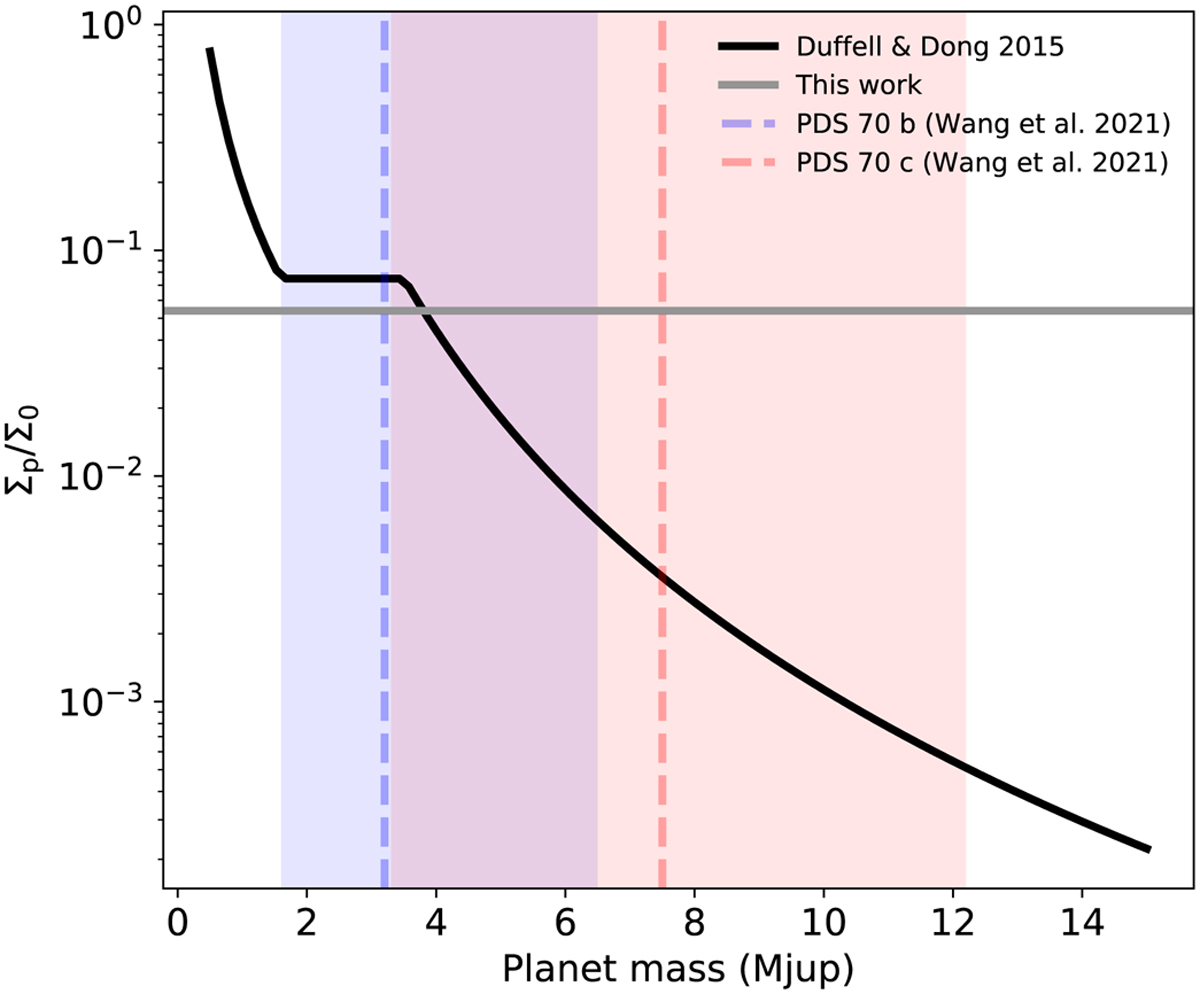
Value of the gas depletion inferred from our model (grey line) overlaid to the scaling relation from Duffell & Dong (2015) (black line). The two curves intersect at ~4MJup. The dashed lines and shaded areas indicate the mean value and the 68% confidence interval for the mass of PDS 70 b and c given by Wang et al. (2021).
Current usage metrics show cumulative count of Article Views (full-text article views including HTML views, PDF and ePub downloads, according to the available data) and Abstracts Views on Vision4Press platform.
Data correspond to usage on the plateform after 2015. The current usage metrics is available 48-96 hours after online publication and is updated daily on week days.
Initial download of the metrics may take a while.