Fig. 2
Download original image
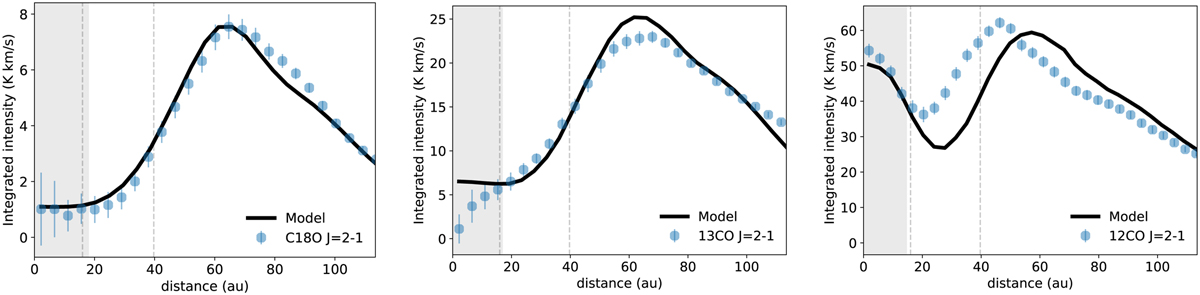
Azimuthally averaged profiles for the integrated intensity of C18O J= 2–1 (left), 13CO J=2–1 (middle), and 12CO J = 2–1 (right). The solid lines are the modelled profiles, and the blue dots are the ALMA observations. Vertical dashed lines indicate the limits of the dust gap. The shaded area indicates the resolution element of the C18O J = 2–1 observation of 0.16 arcsec.
Current usage metrics show cumulative count of Article Views (full-text article views including HTML views, PDF and ePub downloads, according to the available data) and Abstracts Views on Vision4Press platform.
Data correspond to usage on the plateform after 2015. The current usage metrics is available 48-96 hours after online publication and is updated daily on week days.
Initial download of the metrics may take a while.