Fig. A.5
Download original image
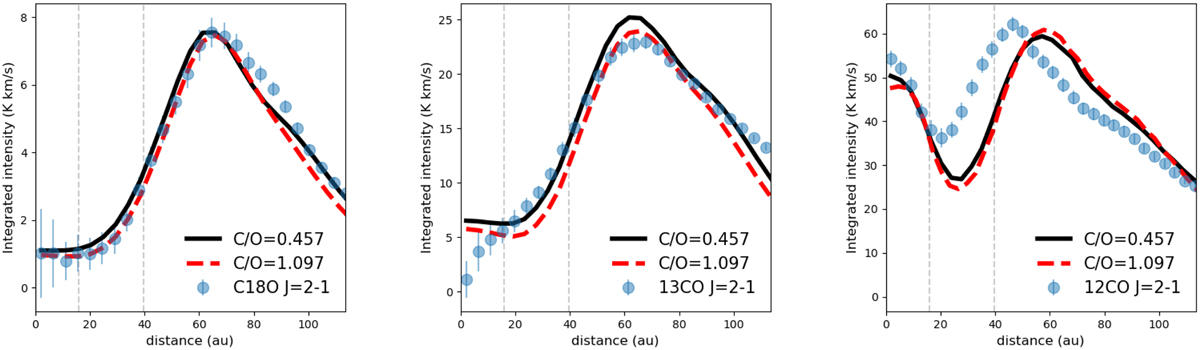
Azimuthally averaged profiles for C18O J = 2 – 1 (left), 13CO J = 2 – 1 (middle), and 12CO J = 2 – 1 (right) moment zero maps. The modelled curves are the results from two models with different C/O ratios in the disc. The black solid lines were retrieved from the best representative model that uses C/O = 0.457, and the red dashed lines represent simulations with C/O = 1.097. The vertical dashed lines indicate the limits of the dust gap.
Current usage metrics show cumulative count of Article Views (full-text article views including HTML views, PDF and ePub downloads, according to the available data) and Abstracts Views on Vision4Press platform.
Data correspond to usage on the plateform after 2015. The current usage metrics is available 48-96 hours after online publication and is updated daily on week days.
Initial download of the metrics may take a while.