Fig. 1

Download original image
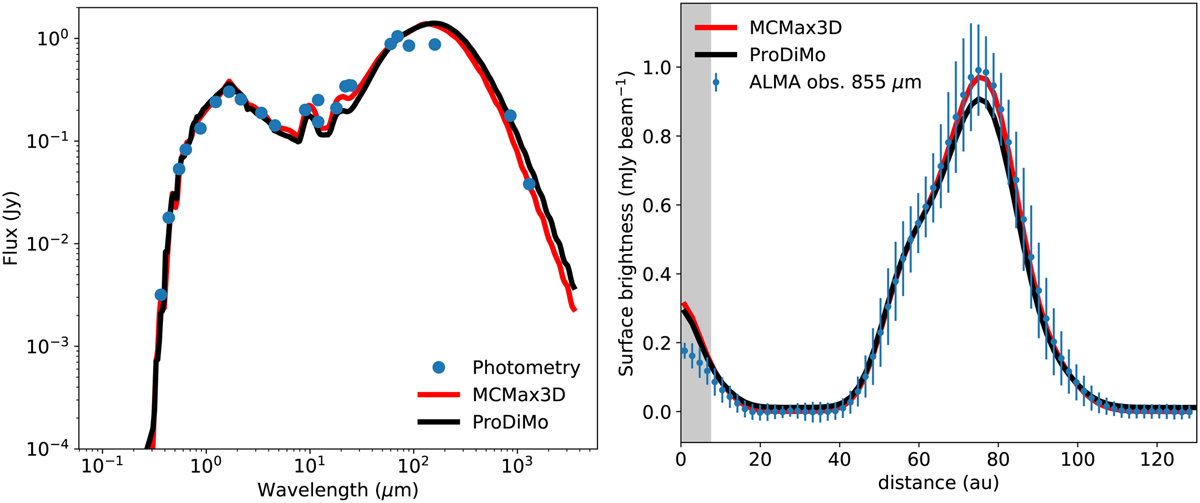
Synthetic observables for the continuum compared to data. Left: predicted spectral energy distribution (black and red curves) and photometry towards PDS 70 (blue dots). The photometric data were taken from Gregorio-Hetem et al. (1992), Cutri et al. (2003), Hashimoto et al. (2012), and Keppler et al. (2019). The value at 855 µm (Keppler et al. 2019) is from integrating the brightness distribution over an elliptical aperture of the projected radius 130 au. Right: azimuthally averaged radial profiles from the ALMA continuum observation at 855 µm and from the modelled images ray traced at the same wavelength. The shaded area indicates the resolution element of the continuum observation of 0.067 arcsec.
Current usage metrics show cumulative count of Article Views (full-text article views including HTML views, PDF and ePub downloads, according to the available data) and Abstracts Views on Vision4Press platform.
Data correspond to usage on the plateform after 2015. The current usage metrics is available 48-96 hours after online publication and is updated daily on week days.
Initial download of the metrics may take a while.


