Open Access
Fig. 6.
Download original image
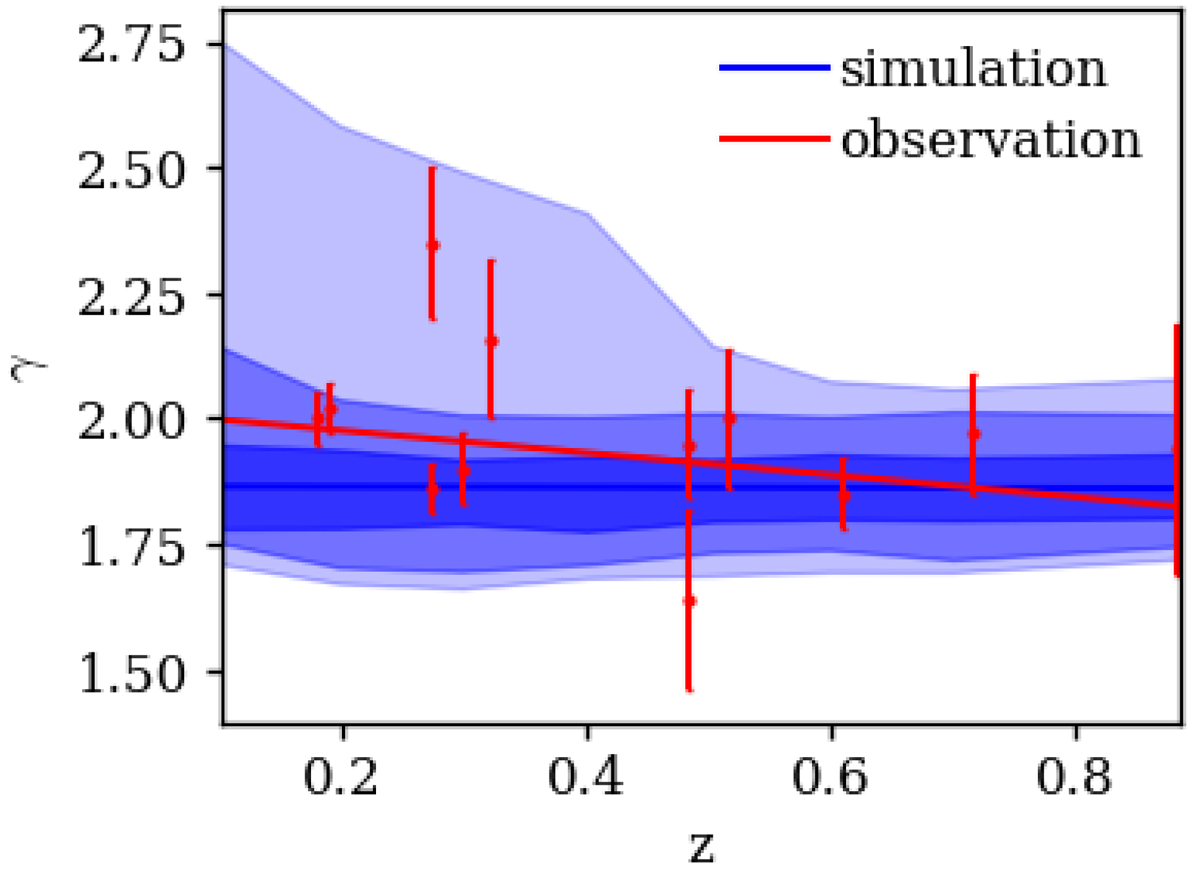
Mass slope comparison of simulated (blue) and observed galaxies (red). The red line is a linear fit to the observed mass slopes over redshift. The blue shaded regions correspond to the 1-σ, 2-σ, and 3-σ bands inferred from simulated galaxies.
Current usage metrics show cumulative count of Article Views (full-text article views including HTML views, PDF and ePub downloads, according to the available data) and Abstracts Views on Vision4Press platform.
Data correspond to usage on the plateform after 2015. The current usage metrics is available 48-96 hours after online publication and is updated daily on week days.
Initial download of the metrics may take a while.