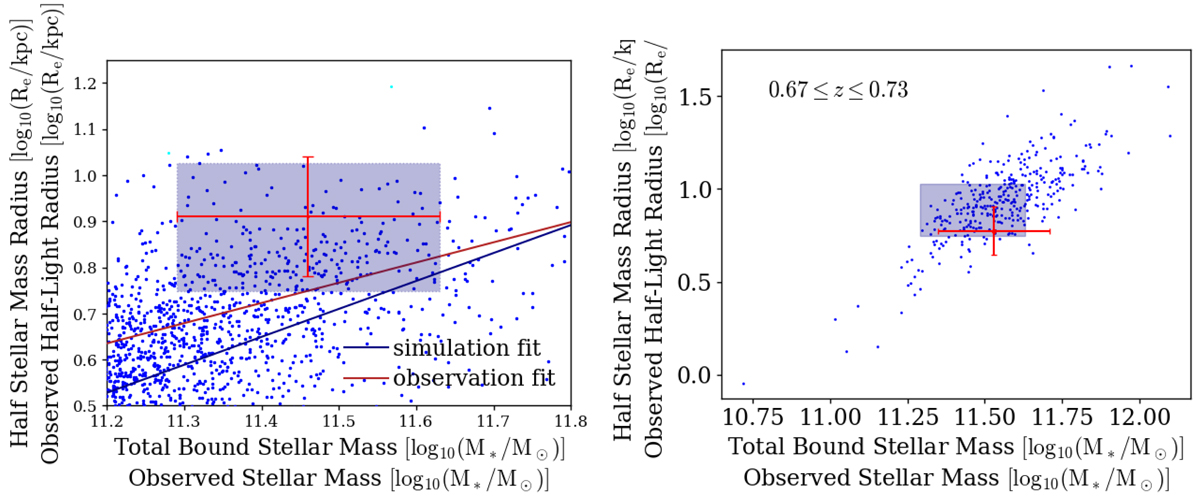
Fig. 3.
Download original image
Matching simulated and observed galaxies. Left: size-stellar mass distribution of the simulated galaxies at z = 0.89 (blue) and the target galaxy at redshift z = 0.884 (red error bar). The 158 simulated galaxies in the blue shaded box are considered as the counterparts of the target galaxy. Right: blue points represent the size-stellar mass distribution of the 158 simulated analogs at z = 0.7. Their size and stellar mass have evolved, as indicated by the blue shaded box that brackets their distributions at z = 0.89. The red error bar indicates an observed lensing galaxy that was identified as a descendant of the target galaxy at z = 0.7. All the 158 simulated analogs and the identified observed descendant(s) are used to estimate the simulated and observed property (the total mass slope in this work) of the target galaxy at z = 0.7, respectively.
Current usage metrics show cumulative count of Article Views (full-text article views including HTML views, PDF and ePub downloads, according to the available data) and Abstracts Views on Vision4Press platform.
Data correspond to usage on the plateform after 2015. The current usage metrics is available 48-96 hours after online publication and is updated daily on week days.
Initial download of the metrics may take a while.