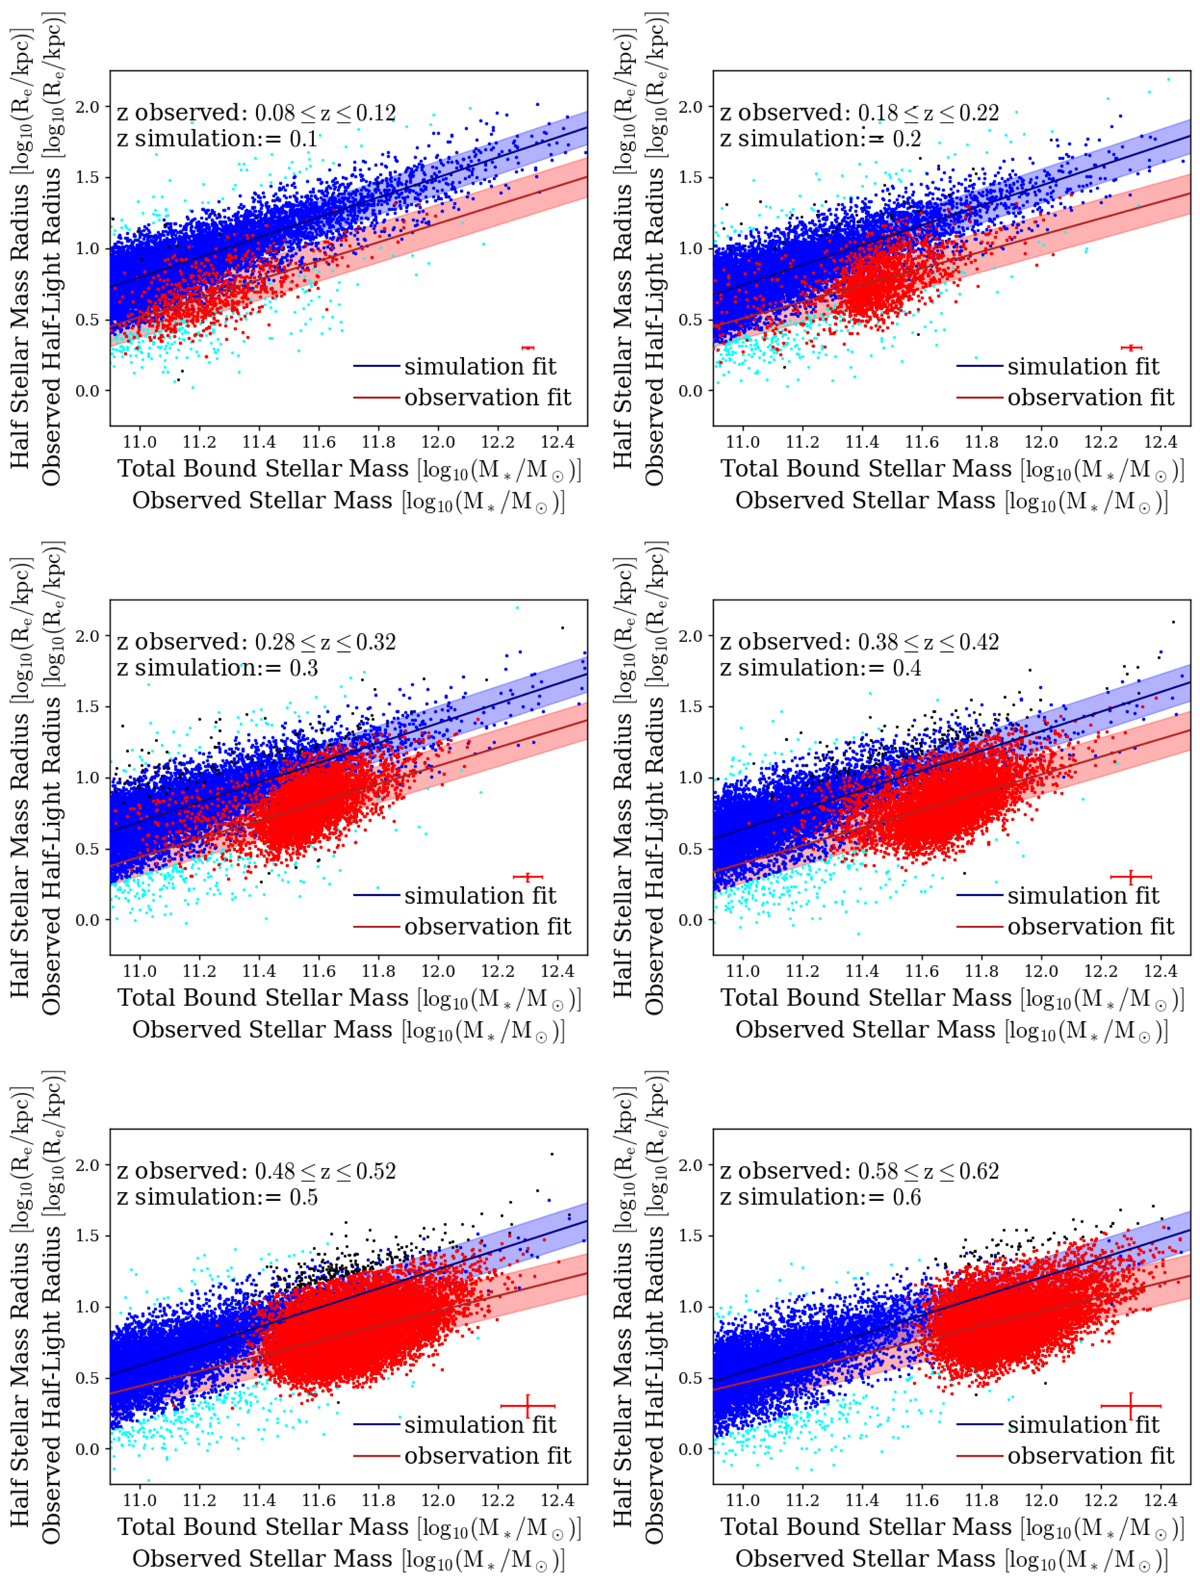
Fig. 1.
Download original image
Size-stellar mass relations at eight redshift bins from 0.1 to 0.89. The y-axis is the half light radius in i-band in log10(Re/kpc) for observed galaxies or the projected half stellar mass radius in log10(Re/kpc) for simulated galaxies. The x-axis is the stellar mass in log10(M*/M⊙) for observed galaxies or the total bound stellar mass of a subhalo in log10(M*/M⊙). The observed data points, as well as their best fit, are shown in red, with the mean scatter of the points around the best fit as colored region around it. The median error of the observed data points is shown on the bottom right corner of the plot. The simulated data points and their best fit relation are shown in blue. The cyan colored dots are outliers of the simulated galaxies, identified by 3σ clipping, that were neglected in the fitting process.
Current usage metrics show cumulative count of Article Views (full-text article views including HTML views, PDF and ePub downloads, according to the available data) and Abstracts Views on Vision4Press platform.
Data correspond to usage on the plateform after 2015. The current usage metrics is available 48-96 hours after online publication and is updated daily on week days.
Initial download of the metrics may take a while.