Fig. 7.
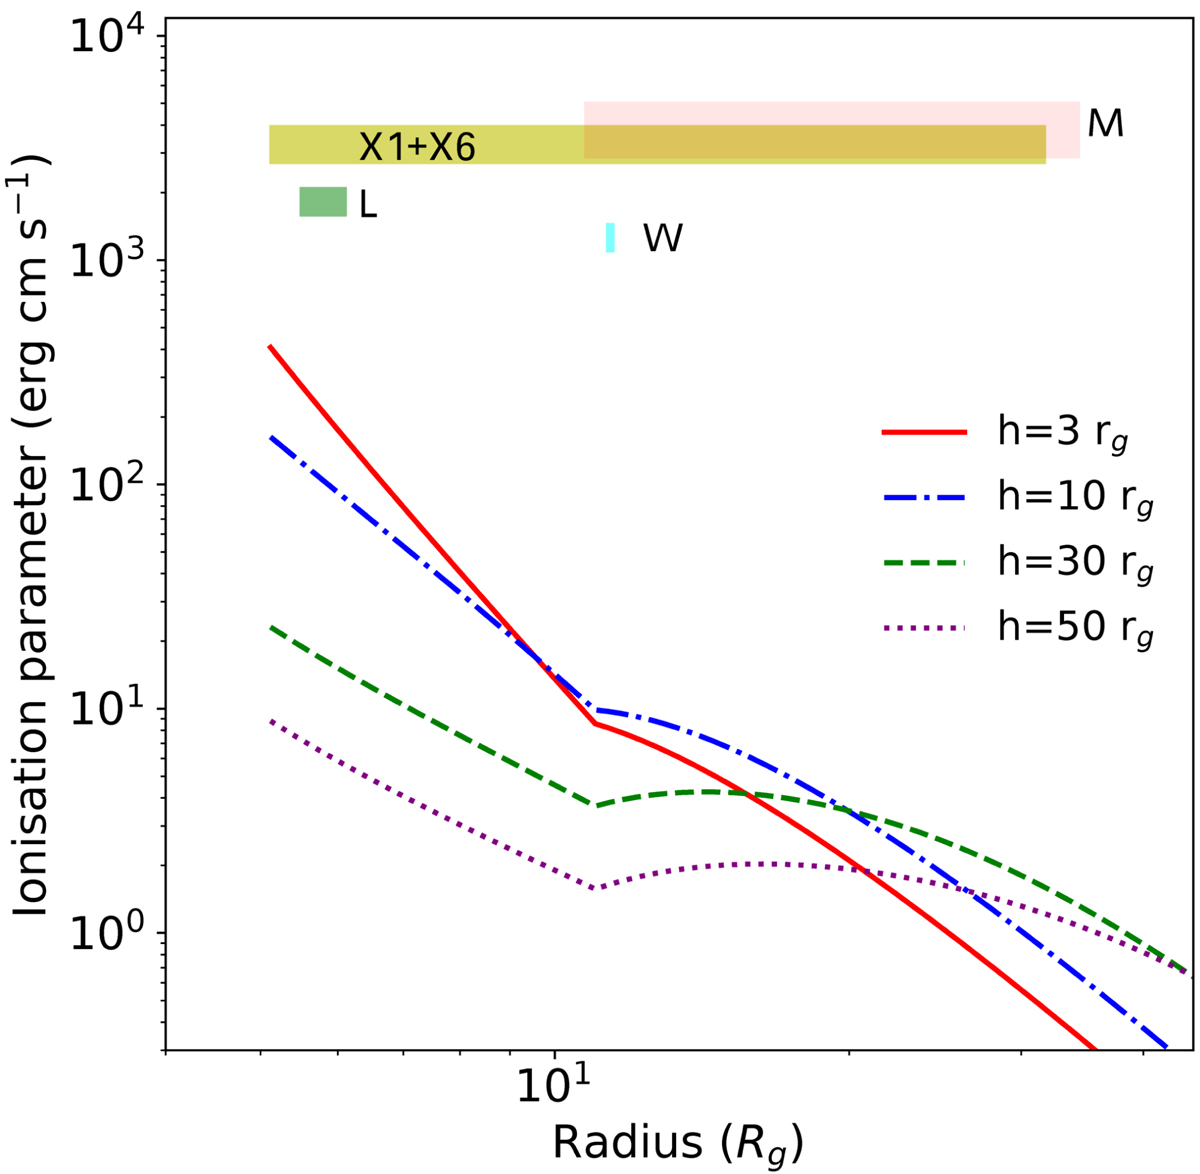
Download original image
Predicted ionization profiles of an accretion disk illuminated by a lamppost X-ray source located at different heights above the central source. We applied Eq. (1) from Ballantyne (2017) for the curve generation. We assumed η = 0.2, α = 0.3, λ = 0.2, and f = 0.45, and set the (RR, Rz, RT) factors at r < 11 Rg to their values at r = 11 Rg to avoid an unphysical break in ξ(r, h). In the plot, the predicted ionization curves are compared with the ionization parameter measured from the observations in the hard spectral state in Ludlam et al. (2017) (L), Wang et al. (2017) (W), Mondal et al. (2021) (M), and this work (X1+X6), respectively.
Current usage metrics show cumulative count of Article Views (full-text article views including HTML views, PDF and ePub downloads, according to the available data) and Abstracts Views on Vision4Press platform.
Data correspond to usage on the plateform after 2015. The current usage metrics is available 48-96 hours after online publication and is updated daily on week days.
Initial download of the metrics may take a while.