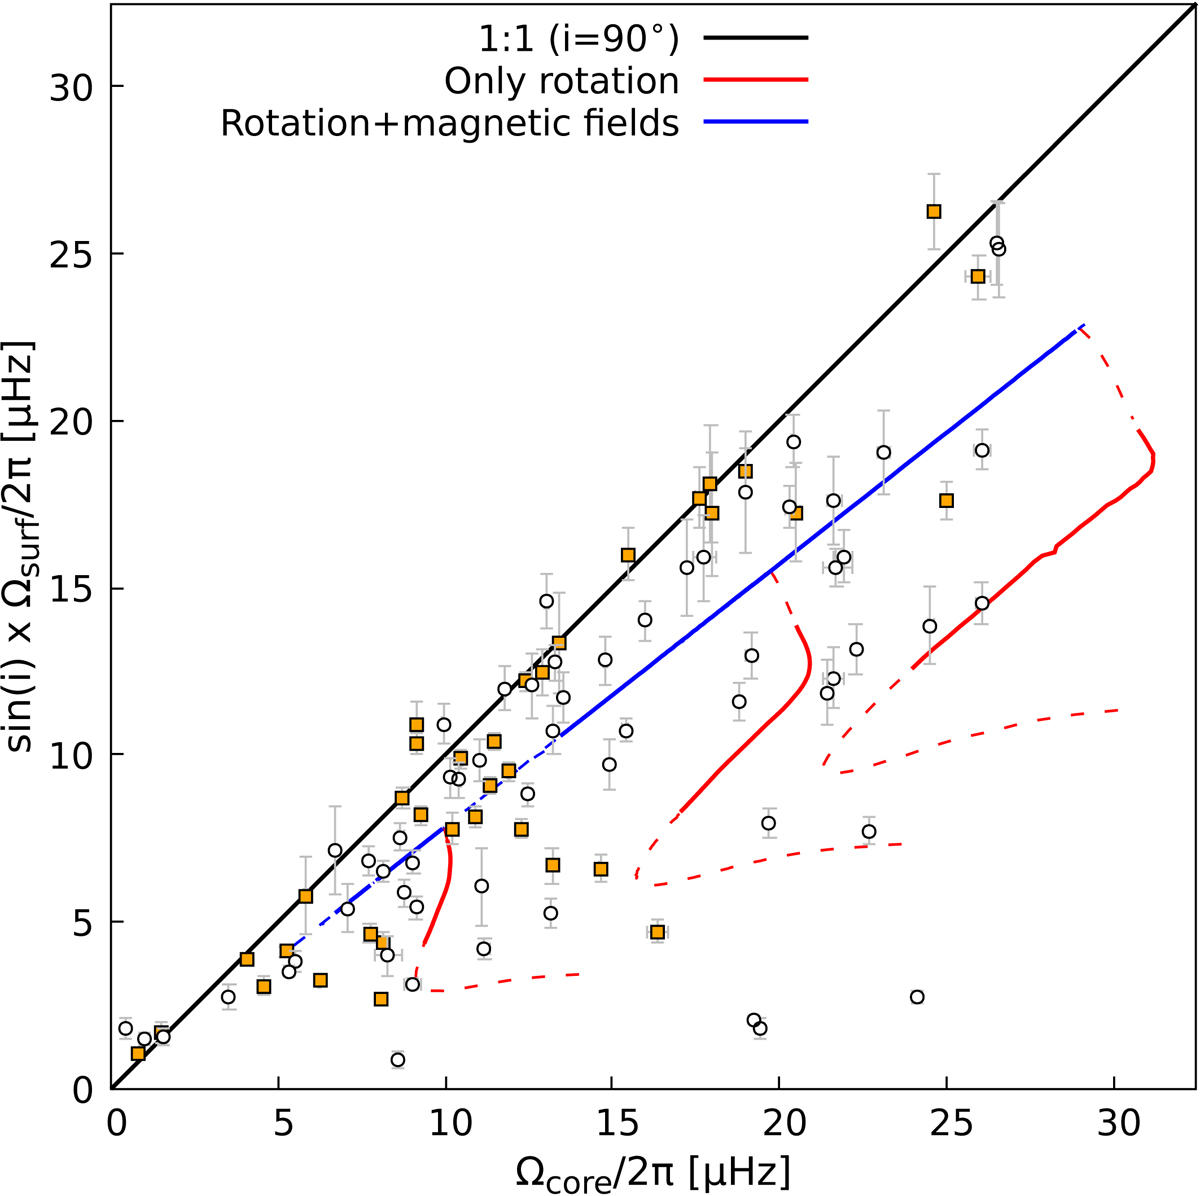
Fig. 8.
Download original image
Surface rotation rates as a function of core rotation rate. The surface rotation rates are obtained by dividing the projected rotational surface velocities by the radius of each star. The dots represent the data set used in this work (see Sect. 2), while the red and blue lines have the same meaning as in Fig. 7, and the black line shows the one-to-one relation.
Current usage metrics show cumulative count of Article Views (full-text article views including HTML views, PDF and ePub downloads, according to the available data) and Abstracts Views on Vision4Press platform.
Data correspond to usage on the plateform after 2015. The current usage metrics is available 48-96 hours after online publication and is updated daily on week days.
Initial download of the metrics may take a while.