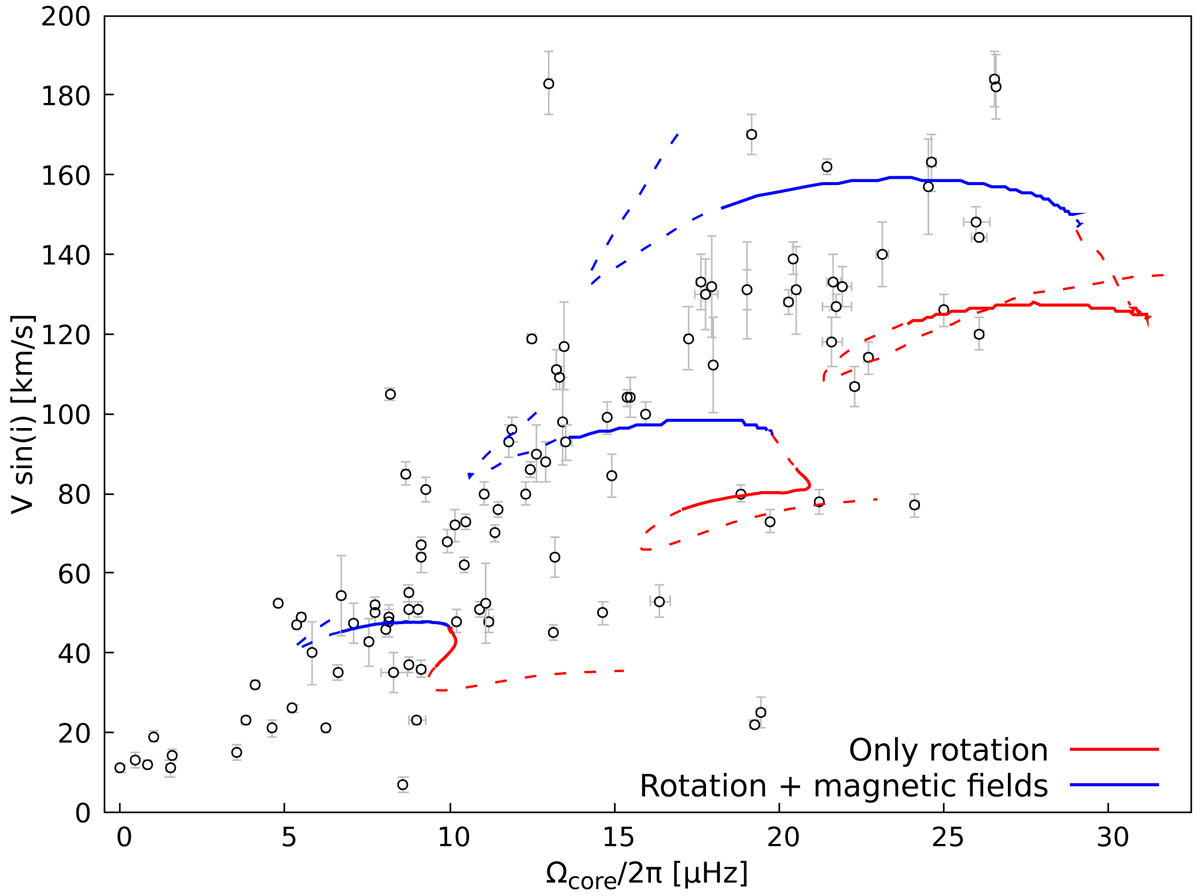
Fig. 7.
Download original image
Projected surface rotational velocity as a function of core rotation rate. The lines correspond to models with an initial mass of M = 1.5 M⊙ and initial metallicity Z = 0.01 shown only during the main sequence, computed with initial rotation rates of Ωcore/2π = 10, 20, and 30 μHz, starting at the ZAMS. The blue and red lines indicate the type of AM transport assumed in each model: only hydrodynamical processes (red) or including internal magnetic fields and hydrodynamical processes (blue). The data points are γ Dor stars with constraints available from the literature (see Sect. 2). The solid lines represent the regions where the buoyancy radius of the models is in agreement with the mean values of the sample.
Current usage metrics show cumulative count of Article Views (full-text article views including HTML views, PDF and ePub downloads, according to the available data) and Abstracts Views on Vision4Press platform.
Data correspond to usage on the plateform after 2015. The current usage metrics is available 48-96 hours after online publication and is updated daily on week days.
Initial download of the metrics may take a while.