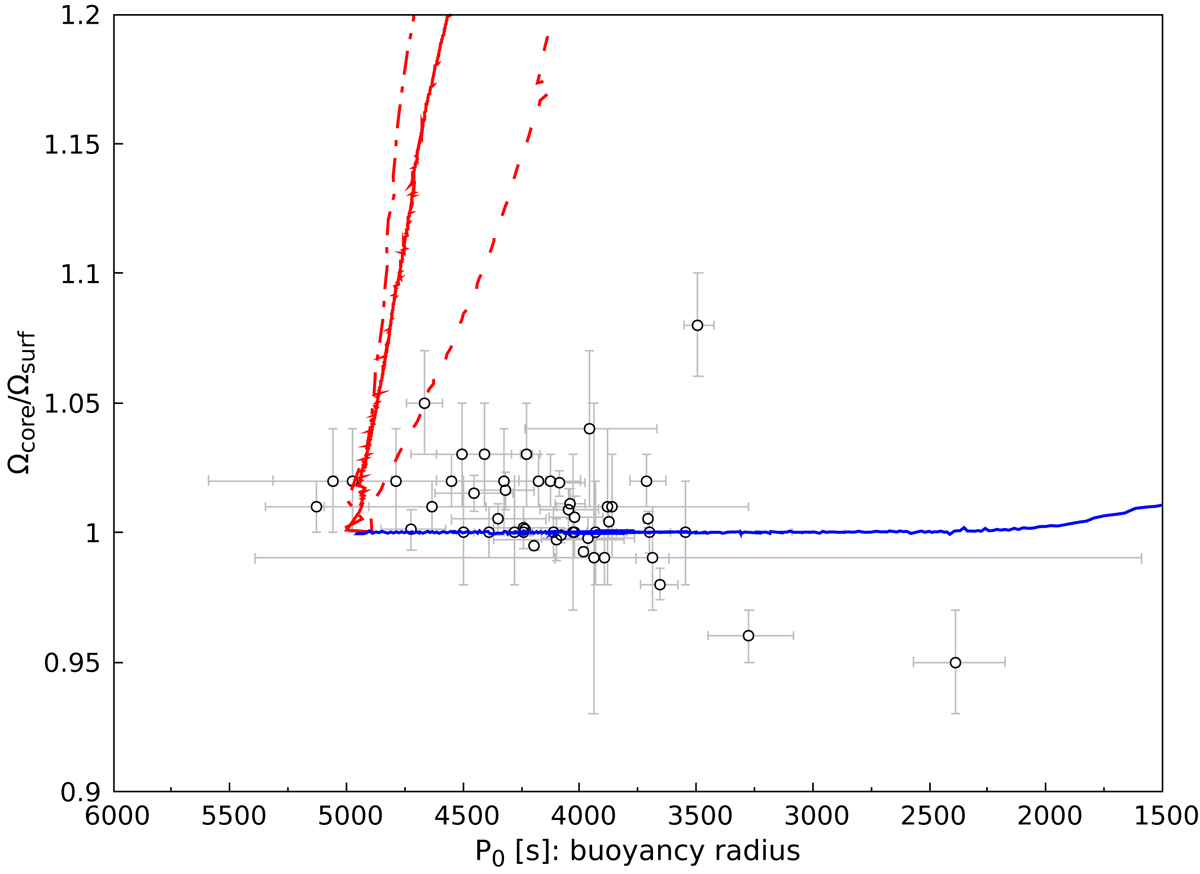
Fig. 17.
Download original image
Ratio of core to surface rotation rate as a function of buoyancy radius for models with initial mass and metallicity of M = 1.5 M⊙ and Z = 0.01, respectively. The data points correspond to the data presented by Li et al. (2020). The red and blue lines are models computed with hydrodynamical processes only (red) or both hydrodynamical processes and internal magnetic fields (blue). The models without internal magnetic fields are shown for three different initial rotation rates of Ω/2π = 10, 20, and 30 μHz (dashed, solid, and dot-dashed lines, respectively). For models with internal magnetic fields, only the one starting with Ω/2π = 20 μHz is shown.
Current usage metrics show cumulative count of Article Views (full-text article views including HTML views, PDF and ePub downloads, according to the available data) and Abstracts Views on Vision4Press platform.
Data correspond to usage on the plateform after 2015. The current usage metrics is available 48-96 hours after online publication and is updated daily on week days.
Initial download of the metrics may take a while.