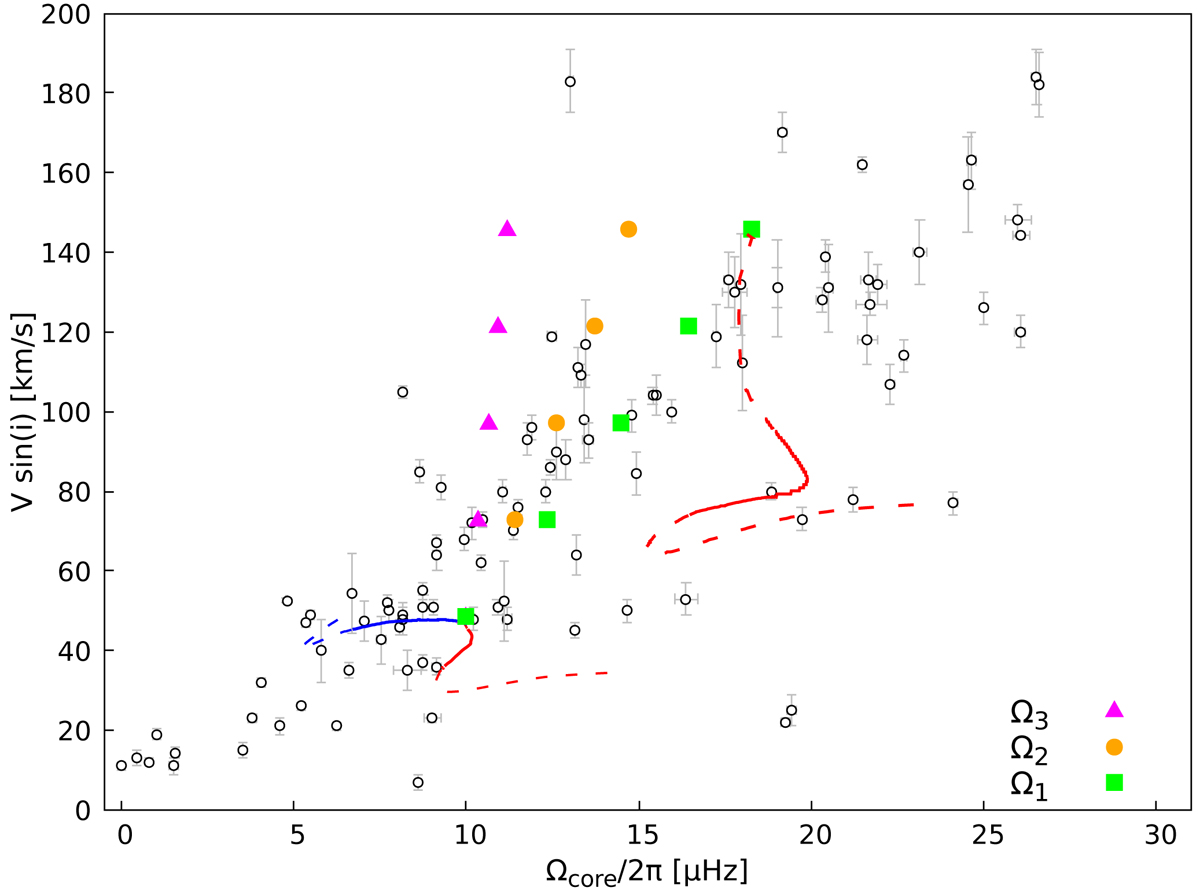
Fig. 13.
Download original image
Same as Fig. 7, but assuming different initial rotational profiles. The points correspond to the ZAMS location of models starting with an initial rotation rate of Ωcc/2π = 10 μHz, but assuming different degrees of differential rotation and rotation profiles (see Fig. 12). The points are shown for initial contrasts of Ωsurf/Ωcc = 1, 1.5, 2, 2.5, and 3, where the solid-body rotation profile (Ωsurf/Ωcc = 1) coincides with the starting point of the models (blue and red lines). The red line model starting from the upper green square was computed without internal magnetic fields and with an initial surface rotation rate three times higher than its core.
Current usage metrics show cumulative count of Article Views (full-text article views including HTML views, PDF and ePub downloads, according to the available data) and Abstracts Views on Vision4Press platform.
Data correspond to usage on the plateform after 2015. The current usage metrics is available 48-96 hours after online publication and is updated daily on week days.
Initial download of the metrics may take a while.