Fig. 9
Download original image
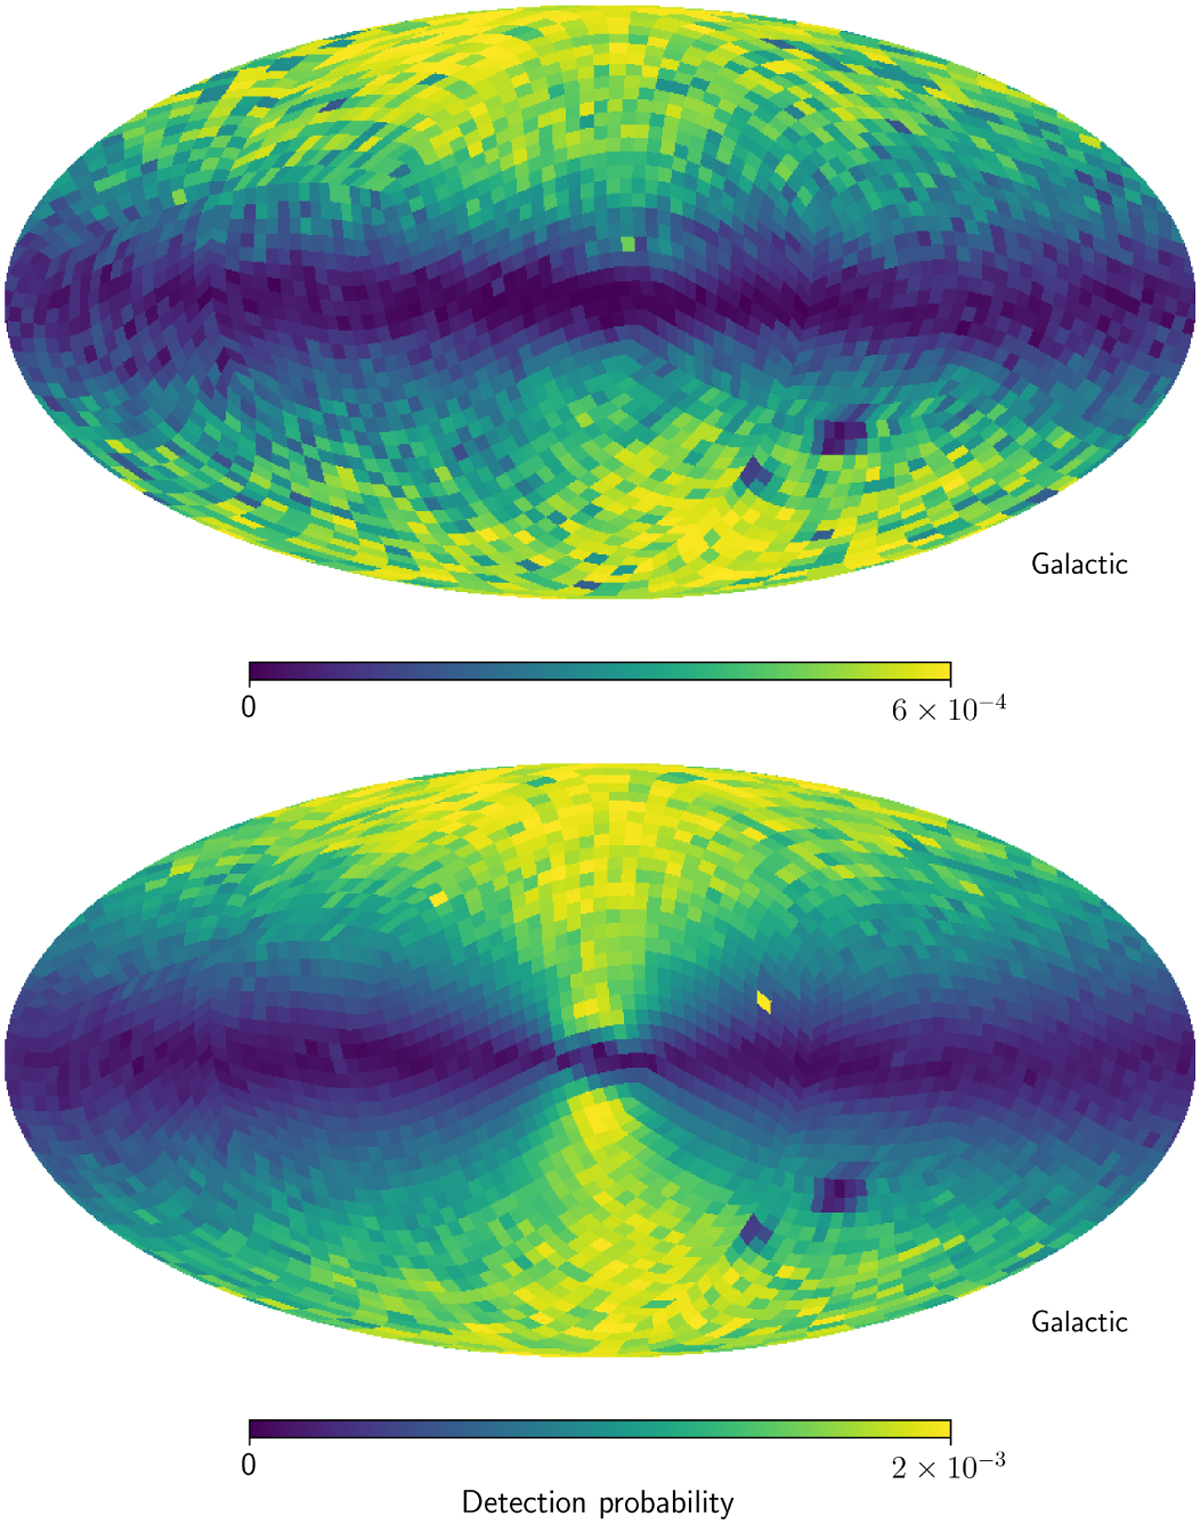
Selection function for the sources selected to be part of GS/E, described by the sources with RVs, ϖ > 0.1 mas, ϖ/σϖ > 5 mas, and −1500 < Lz < 150 kpc km s−1, with respect to Gaia DR2 and DR3 in the top and bottom panels, respectively. The top panel belongs to the original sample in Gaia DR2 described by Helmi et al. (2018), while the bottom panel shows the same cuts applied to Gaia DR3. The maps correspond to the resolution of HEALPix level 4. The magnitude and colour dependencies have been marginalised out.
Current usage metrics show cumulative count of Article Views (full-text article views including HTML views, PDF and ePub downloads, according to the available data) and Abstracts Views on Vision4Press platform.
Data correspond to usage on the plateform after 2015. The current usage metrics is available 48-96 hours after online publication and is updated daily on week days.
Initial download of the metrics may take a while.