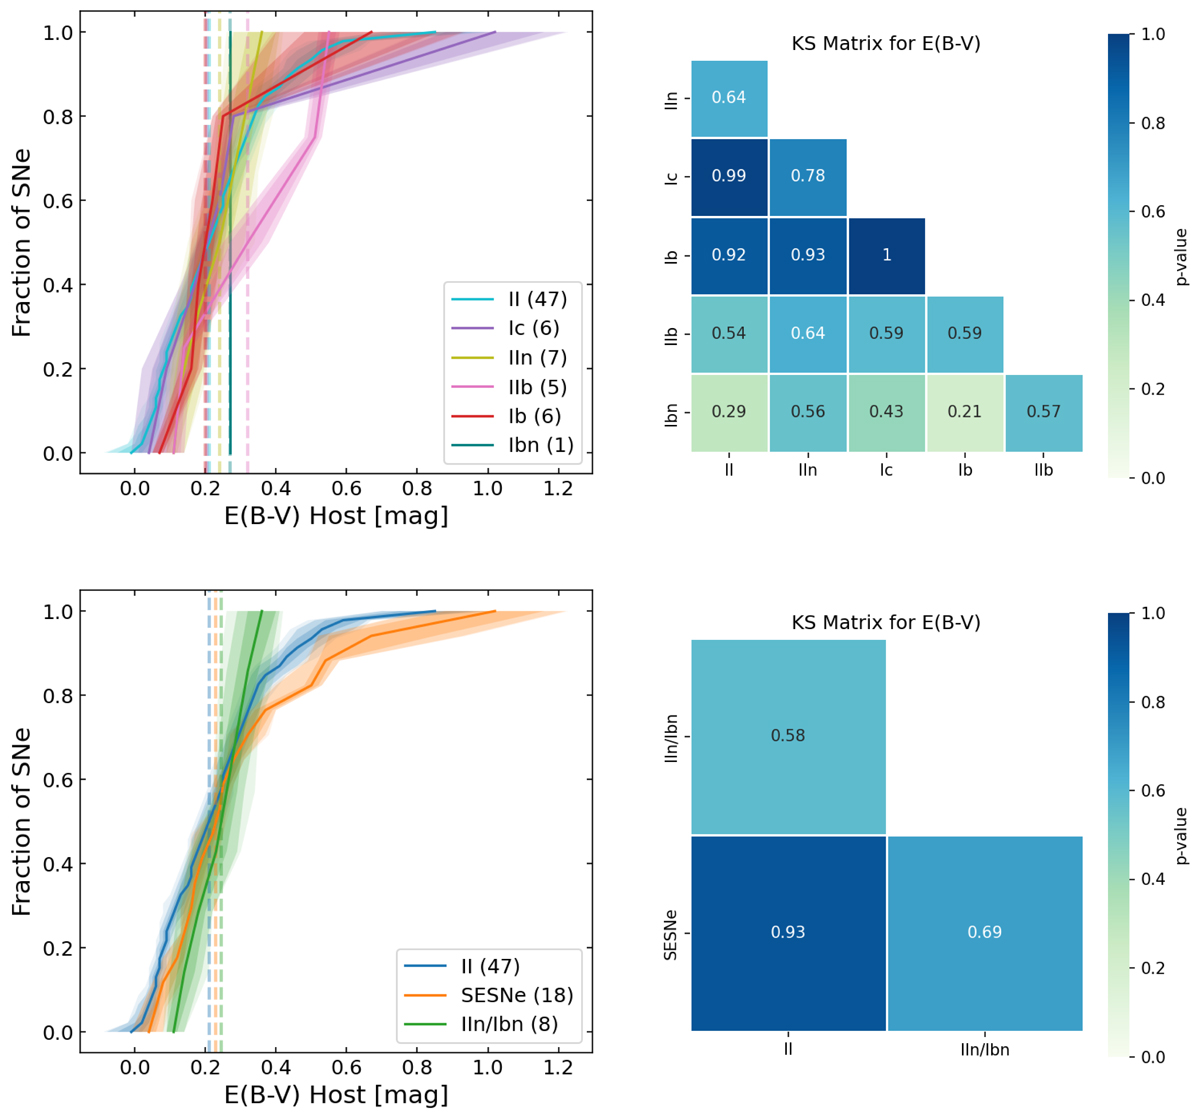
Fig. 8.
Download original image
Cumulative distributions of the line of sight extinction E(B − V), estimated from the Balmer decrement. The top row shows the distributions for the different types of CCSNe, while the bottom row shows the distributions for the CCSNe grouped into SNe II, SESNe, and IIn/Ibn. The right column shows the Kolmogorov–Smirnov (KS) statistic matrix.
Current usage metrics show cumulative count of Article Views (full-text article views including HTML views, PDF and ePub downloads, according to the available data) and Abstracts Views on Vision4Press platform.
Data correspond to usage on the plateform after 2015. The current usage metrics is available 48-96 hours after online publication and is updated daily on week days.
Initial download of the metrics may take a while.