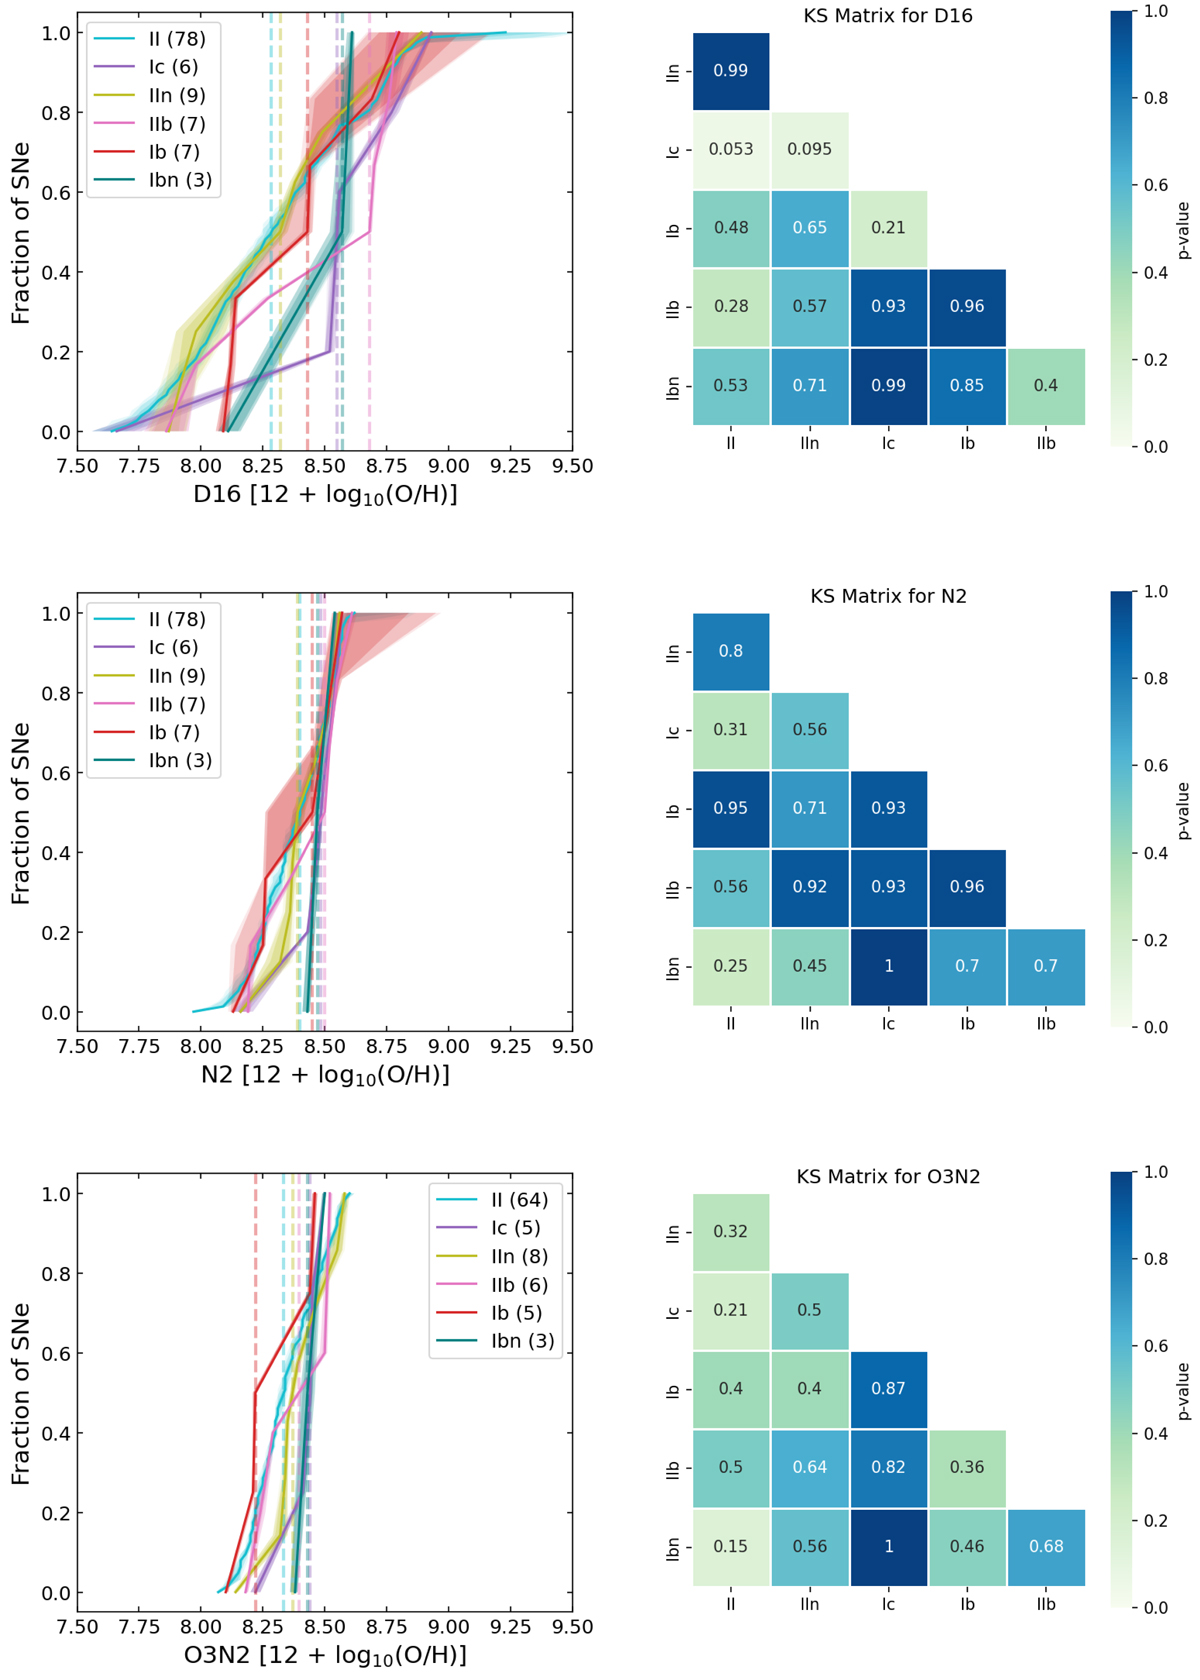
Fig. 4.
Download original image
Cumulative distributions for the D16, N2, and O3N2 oxygen abundance indicators of the different types of CCSNe. The right column shows the Kolmogorov–Smirnov (KS) statistic matrix for the combination of the different SN types. The legend gives the number of SNe used in each distribution and the median oxygen abundance is marked as the dashed linse. The color scale and the matrix values report the KS p-values.
Current usage metrics show cumulative count of Article Views (full-text article views including HTML views, PDF and ePub downloads, according to the available data) and Abstracts Views on Vision4Press platform.
Data correspond to usage on the plateform after 2015. The current usage metrics is available 48-96 hours after online publication and is updated daily on week days.
Initial download of the metrics may take a while.