Fig. F.1.
Download original image
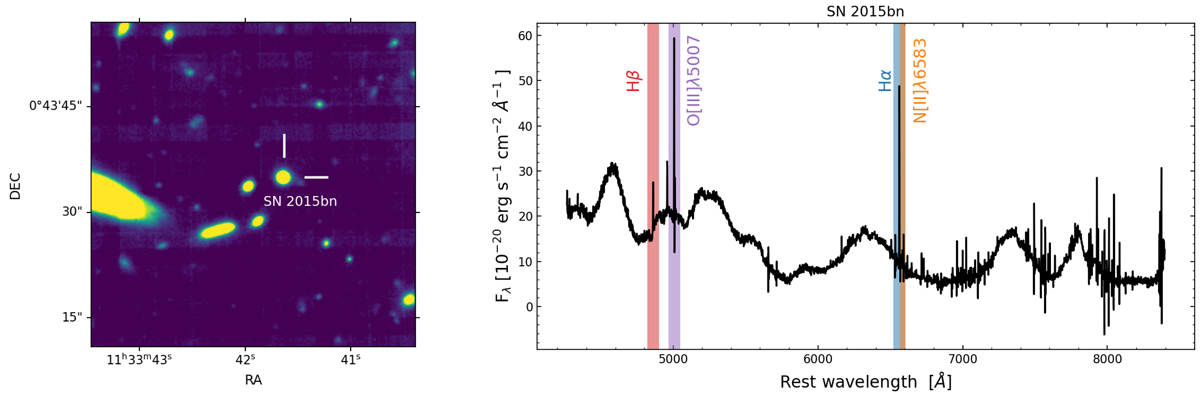
Spectrum fitting for the SLSN 2015bn. Left panel: position of SN 2015bn in the MUSE image of the observed field. Right panel: extracted spectrum for SN 2015bn, where the broad emission lines of the SN are still clearly present. Emission lines of Hα, Hβ, O[III]λ5007, and N[II]λ6583 belonging to the underlying H II region can be identified.
Current usage metrics show cumulative count of Article Views (full-text article views including HTML views, PDF and ePub downloads, according to the available data) and Abstracts Views on Vision4Press platform.
Data correspond to usage on the plateform after 2015. The current usage metrics is available 48-96 hours after online publication and is updated daily on week days.
Initial download of the metrics may take a while.