Fig. C.1.
Download original image
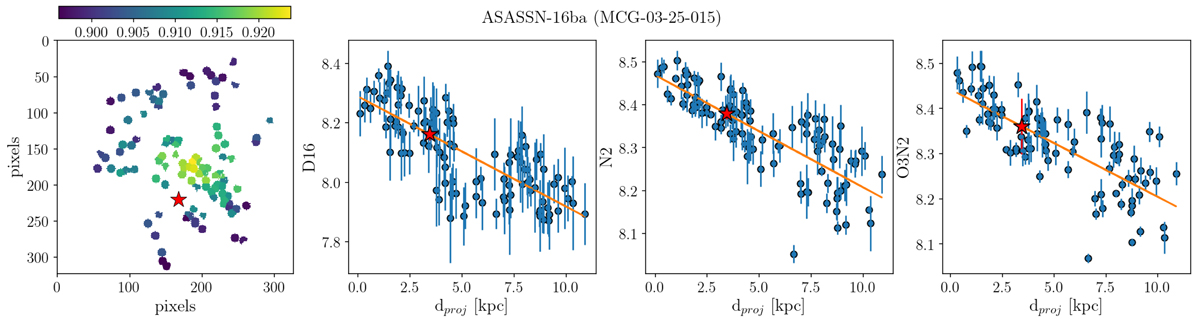
Oxygen abundances fit for ASASSN-16ba, hosted by MCG-03-25-015. The same method was applied for all the SNe where the extracted spectrum at their position has a SNR of < 3. The Left panel shows the spatial distribution in pixels of the H II regions extracted in the galaxy, where the color gradient indicates the oxygen abundance given by the D16 index. The spatial coordinates of the SN in relation to the H II regions is given by the red star. The other three panels show, respectively from left to right, the resulting fit to the oxygen abundance gradient in the D16, N2, and O3N2 indexes. The resulting value for the SN is given by the red star. The x-axis show the deprojected distance from the nucleus in kpc for each H II region.
Current usage metrics show cumulative count of Article Views (full-text article views including HTML views, PDF and ePub downloads, according to the available data) and Abstracts Views on Vision4Press platform.
Data correspond to usage on the plateform after 2015. The current usage metrics is available 48-96 hours after online publication and is updated daily on week days.
Initial download of the metrics may take a while.