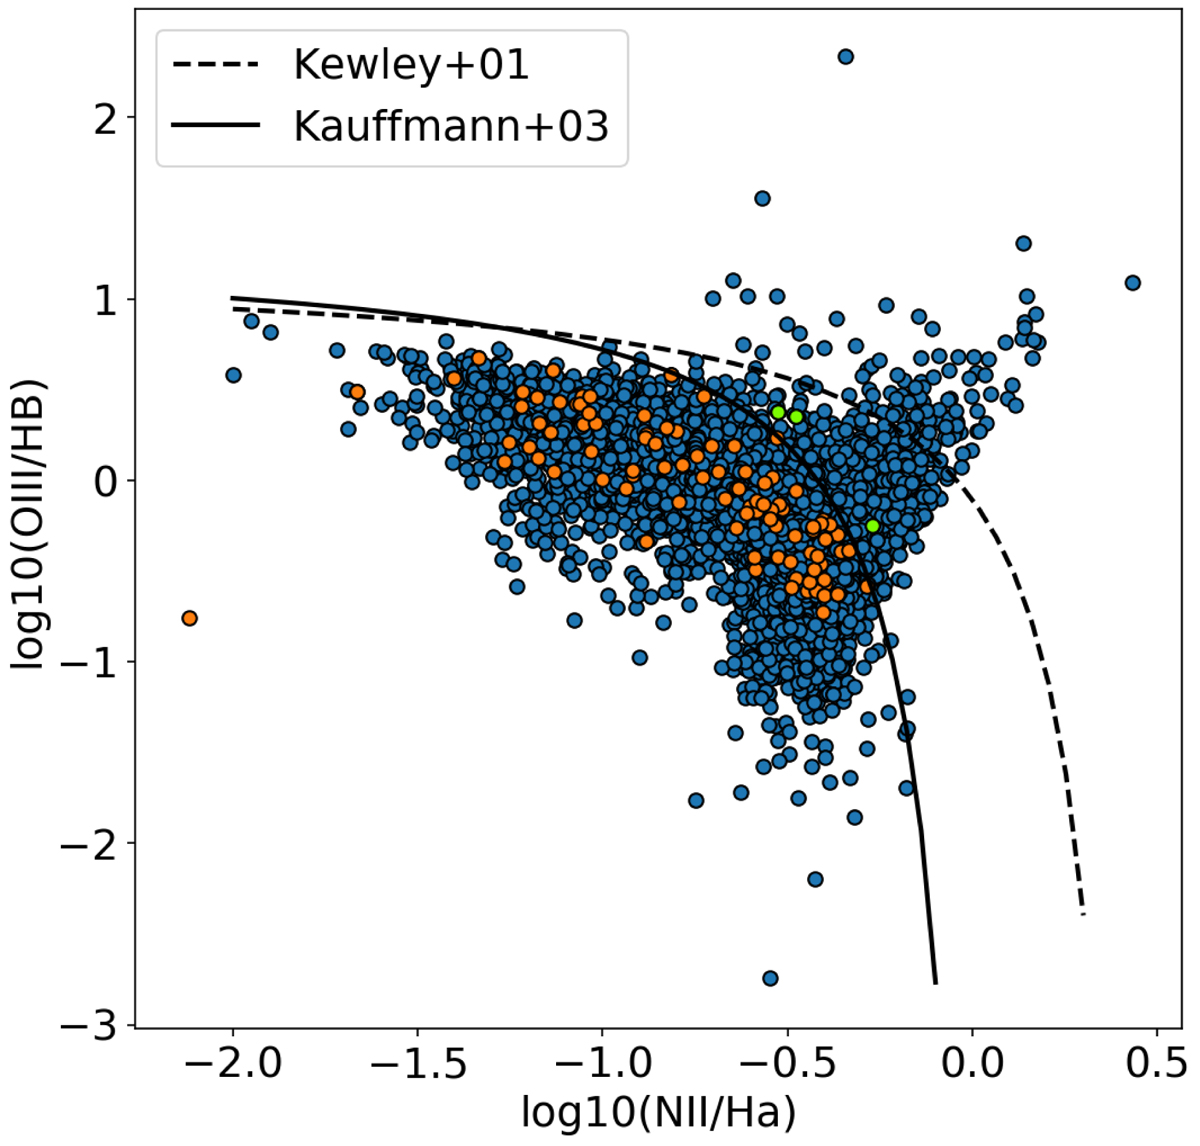
Fig. A.1.
Download original image
BPT diagram of the H II regions in our sample. The blue circles show all the H II regions, while the orange circles mark the position of the H II regions associated to the CCSNe. The green circles show the SNe that are above the composite region (solid line) defined by Kauffmann et al. (2003). We also show the AGN ionization region as the dashed line, as defined by Kewley et al. (2001).
Current usage metrics show cumulative count of Article Views (full-text article views including HTML views, PDF and ePub downloads, according to the available data) and Abstracts Views on Vision4Press platform.
Data correspond to usage on the plateform after 2015. The current usage metrics is available 48-96 hours after online publication and is updated daily on week days.
Initial download of the metrics may take a while.