Open Access
Fig. 3
Download original image
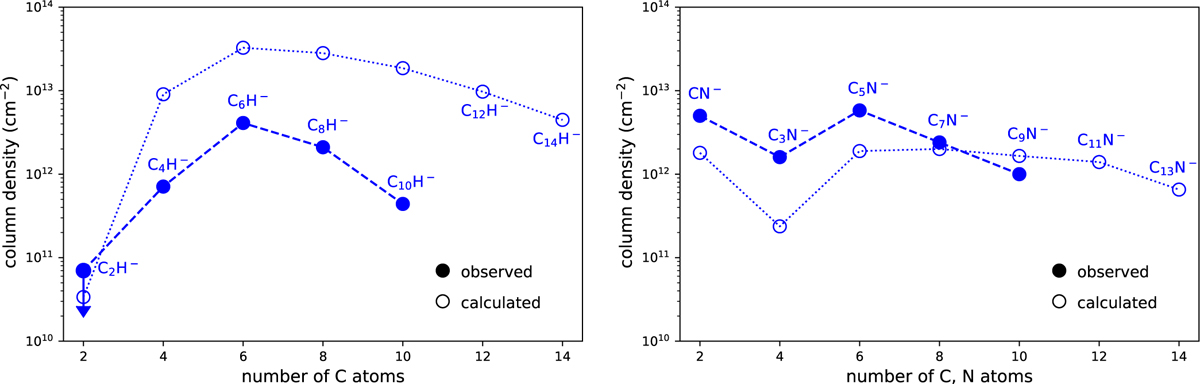
Column densities of negative ions calculated with the chemical model compared with observed values. The left panel shows hydrocarbon anions, while the right panel shows nitrile anions. The observed values for C10H− and C9N− were derived assuming that they are the carriers of the series of lines reported in this work.
Current usage metrics show cumulative count of Article Views (full-text article views including HTML views, PDF and ePub downloads, according to the available data) and Abstracts Views on Vision4Press platform.
Data correspond to usage on the plateform after 2015. The current usage metrics is available 48-96 hours after online publication and is updated daily on week days.
Initial download of the metrics may take a while.